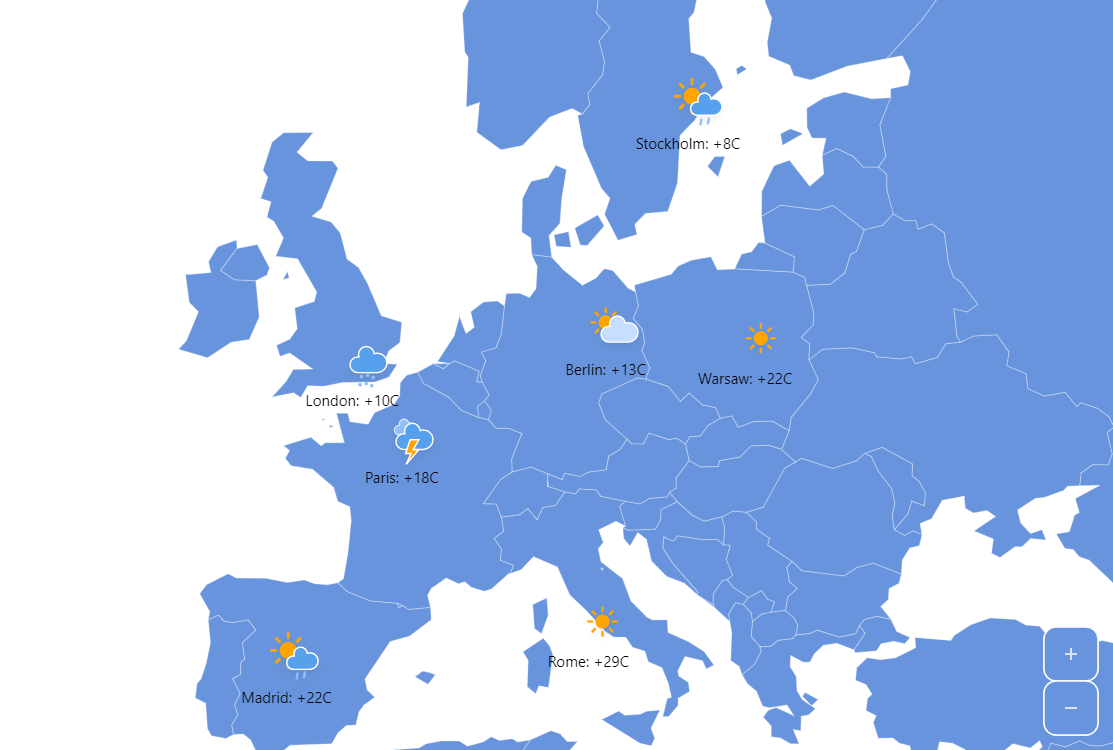
Weather Map
Weather maps is one of the typical use cases for map charts. This demo shows how to use amCharts Maps as a weather map.
Key implementation details
We use MapPointSeries for our city locations on the map and add bullets to the series to display weather icons and labels. templateField settings on the bullets enable the chart to pick the icon and label text from the data.
Related tutorials
Demo source
<!-- Styles -->
<style>
#chartdiv {
  width: 100%;
  height: 500px;
}
</style>

<!-- Resources -->
<script src="https://cdn.amcharts.com/lib/5/index.js"></script>
<script src="https://cdn.amcharts.com/lib/5/map.js"></script>
<script src="https://cdn.amcharts.com/lib/5/geodata/worldLow.js"></script>
<script src="https://cdn.amcharts.com/lib/5/themes/Animated.js"></script>

<!-- Chart code -->
<script>
am5.ready(function() {

// Create root element
// https://www.amcharts.com/docs/v5/getting-started/#Root_element
var root = am5.Root.new("chartdiv");


// Set themes
// https://www.amcharts.com/docs/v5/concepts/themes/
root.setThemes([
  am5themes_Animated.new(root)
]);


// Create the map chart
// https://www.amcharts.com/docs/v5/charts/map-chart/
var chart = root.container.children.push(am5map.MapChart.new(root, {
  panX: "translateX",
  panY: "translateY",
  projection: am5map.geoMercator(),
  homeGeoPoint: { longitude: 10, latitude: 51 },
  homeZoomLevel: 6
}));


// Create main polygon series for countries
// https://www.amcharts.com/docs/v5/charts/map-chart/map-polygon-series/
var polygonSeries = chart.series.push(am5map.MapPolygonSeries.new(root, {
  geoJSON: am5geodata_worldLow,
  exclude: ["AQ"]
}));

// Add zoom control
// https://www.amcharts.com/docs/v5/charts/map-chart/map-pan-zoom/#Zoom_control
var zoomControl = chart.set("zoomControl", am5map.ZoomControl.new(root, {}));
zoomControl.homeButton.set("visible", true);

// Set clicking on "water" to zoom out
chart.chartContainer.get("background").events.on("click", function() {
  chart.goHome();
})

polygonSeries.events.on("datavalidated", function() {
  chart.goHome();
})

var pointSeries = chart.series.push(am5map.MapPointSeries.new(root, {}));
pointSeries.bullets.push(function() {
  return am5.Bullet.new(root, {
    sprite: am5.Picture.new(root, {
      templateField: "pictureSettings"
    })
  })
})

pointSeries.bullets.push(function() {
  return am5.Bullet.new(root, {
    sprite: am5.Label.new(root, {
      templateField: "labelSettings",
      centerX: am5.p50,
      dy: 10
    })
  })
})

pointSeries.data.setAll([{
  geometry: { type: "Point", coordinates: [-3.703790, 40.416775] },
  pictureSettings: {
    src: "https://www.amcharts.com/wp-content/uploads/assets/weather/animated/rainy-1.svg",
    width: 50,
    height: 50,
    centerX: am5.p50,
    centerY: am5.p50
  },
  labelSettings: {
    text: "Madrid: +22C"
  }
},
{
  geometry: { type: "Point", coordinates: [2.352222, 48.856614] },
  pictureSettings: {
    src: "https://www.amcharts.com/wp-content/uploads/assets/weather/animated/thunder.svg",
    width: 50,
    height: 50,
    centerX: am5.p50,
    centerY: am5.p50
  },
  labelSettings: {
    text: "Paris: +18C"
  }
},
{
  geometry: { type: "Point", coordinates: [13.404954, 52.520007] },
  pictureSettings: {
    src: "https://www.amcharts.com/wp-content/uploads/assets/weather/animated/cloudy-day-1.svg",
    width: 50,
    height: 50,
    centerX: am5.p50,
    centerY: am5.p50
  },
  labelSettings: {
    text: "Berlin: +13C"
  }
},
{
  geometry: { type: "Point", coordinates: [21.012229, 52.229676] },
  pictureSettings: {
    src: "https://www.amcharts.com/wp-content/uploads/assets/weather/animated/day.svg",
    width: 50,
    height: 50,
    centerX: am5.p50,
    centerY: am5.p50
  },
  labelSettings: {
    text: "Warsaw: +22C"
  }
},
{
  geometry: { type: "Point", coordinates: [12.480180, 41.872389] },
  pictureSettings: {
    src: "https://www.amcharts.com/wp-content/uploads/assets/weather/animated/day.svg",
    width: 50,
    height: 50,
    centerX: am5.p50,
    centerY: am5.p50
  },
  labelSettings: {
    text: "Rome: +29C"
  }
},
{
  geometry: { type: "Point", coordinates: [-0.127758, 51.507351] },
  pictureSettings: {
    src: "https://www.amcharts.com/wp-content/uploads/assets/weather/animated/rainy-7.svg",
    width: 50,
    height: 50,
    centerX: am5.p50,
    centerY: am5.p50
  },
  labelSettings: {
    text: "London: +10C"
  }
},
{
  geometry: { type: "Point", coordinates: [18.068581, 59.329323] },
  pictureSettings: {
    src: "https://www.amcharts.com/wp-content/uploads/assets/weather/animated/rainy-1.svg",
    width: 50,
    height: 50,
    centerX: am5.p50,
    centerY: am5.p50
  },
  labelSettings: {
    text: "Stockholm: +8C"
  }
}
])

// Make stuff animate on load
chart.appear(1000, 100);

}); // end am5.ready()
</script>

<!-- HTML -->
<div id="chartdiv"></div>