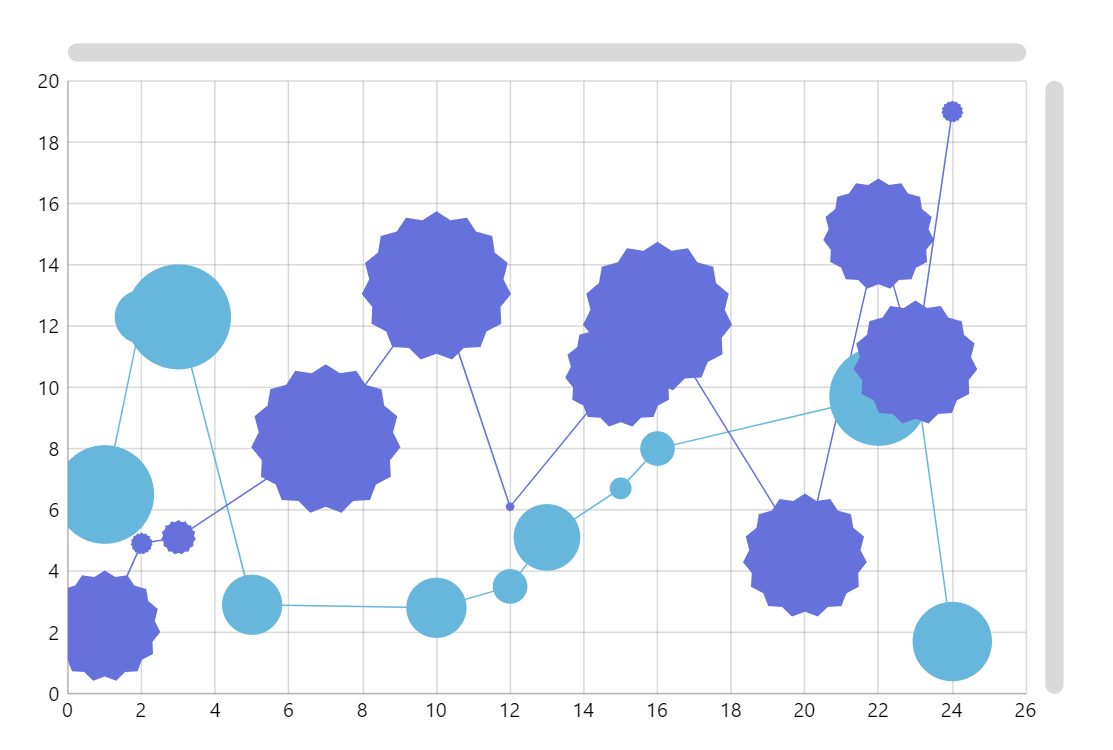
XY Chart with Value-Based Line Graphs
In the most common version of a line chart you have an X-axis representing some categories or date/time and an Y-axis representing values for those categories. In amCharts XY charts you can have any type of axis in each dimension. In this demo we use two value axes and the lines just have two numeric coordinates.
Key implementation details
We add 2 ValueAxis axes to our chart, add LineSeries and specify valueXField and valueYField on the series for the line coordinates.
Related tutorials
Demo source
<!-- Styles -->
<style>
#chartdiv {
  width: 100%;
  height: 500px;
}
</style>

<!-- Resources -->
<script src="https://cdn.amcharts.com/lib/5/index.js"></script>
<script src="https://cdn.amcharts.com/lib/5/xy.js"></script>
<script src="https://cdn.amcharts.com/lib/5/themes/Animated.js"></script>

<!-- Chart code -->
<script>
am5.ready(function() {

// Create root element
// https://www.amcharts.com/docs/v5/getting-started/#Root_element
var root = am5.Root.new("chartdiv");

// Set themes
// https://www.amcharts.com/docs/v5/concepts/themes/
root.setThemes([
  am5themes_Animated.new(root)
]);

// Create chart
// https://www.amcharts.com/docs/v5/charts/xy-chart/
var chart = root.container.children.push(
  am5xy.XYChart.new(root, {
    panX: false,
    panY: false,
    wheelY: "zoomXY",
  pinchZoomX:true,
  pinchZoomY:true
  })
);

chart.get("colors").set("step", 2);

// Create axes
// https://www.amcharts.com/docs/v5/charts/xy-chart/axes/
var xAxis = chart.xAxes.push(
  am5xy.ValueAxis.new(root, {
    renderer: am5xy.AxisRendererX.new(root, { minGridDistance: 50 }),
    tooltip: am5.Tooltip.new(root, {})
  })
);

var yAxis = chart.yAxes.push(
  am5xy.ValueAxis.new(root, {
    renderer: am5xy.AxisRendererY.new(root, {}),
    tooltip: am5.Tooltip.new(root, {})
  })
);

// Create series
// https://www.amcharts.com/docs/v5/charts/xy-chart/series/
var series0 = chart.series.push(
  am5xy.LineSeries.new(root, {
    calculateAggregates: true,
    xAxis: xAxis,
    yAxis: yAxis,
    valueYField: "ay",
    valueXField: "x",
    valueField: "aValue",
    tooltip: am5.Tooltip.new(root, {
      labelText: "x: {valueX}, y: {valueY}, value: {value}"
    })
  })
);

// Add bullet
// https://www.amcharts.com/docs/v5/charts/xy-chart/series/#Bullets
var circleTemplate = am5.Template.new({});
series0.bullets.push(function () {
  var graphics = am5.Circle.new(
    root,
    {
      fill: series0.get("fill")
    },
    circleTemplate
  );
  return am5.Bullet.new(root, {
    sprite: graphics
  });
});

// Add heat rule
// https://www.amcharts.com/docs/v5/concepts/settings/heat-rules/
series0.set("heatRules", [{
  target: circleTemplate,
  min: 3,
  max: 35,
  dataField: "value",
  key: "radius"
}]);

var starTemplate = am5.Template.new({});

// Create second series
// https://www.amcharts.com/docs/v5/charts/xy-chart/series/
var series1 = chart.series.push(
  am5xy.LineSeries.new(root, {
    calculateAggregates: true,
    xAxis: xAxis,
    yAxis: yAxis,
    valueYField: "by",
    valueXField: "x",
    valueField: "bValue",
    tooltip: am5.Tooltip.new(root, {
      labelText: "x: {valueX}, y: {valueY}, value: {value}"
    })
  })
);

// Add bullet
// https://www.amcharts.com/docs/v5/charts/xy-chart/series/#Bullets
series1.bullets.push(function () {
  var graphics = am5.Star.new(root, {
    fill: series1.get("fill"),
    spikes: 15,
    innerRadius: am5.percent(90)
  }, starTemplate);
  return am5.Bullet.new(root, {
    sprite: graphics
  });
});

// Add heat rule
// https://www.amcharts.com/docs/v5/concepts/settings/heat-rules/
series1.set("heatRules", [{
  target: starTemplate,
  min: 3,
  max: 50,
  dataField: "value",
  key: "radius"
}]);

// Add cursor
// https://www.amcharts.com/docs/v5/charts/xy-chart/cursor/
chart.set("cursor", am5xy.XYCursor.new(root, {
  xAxis: xAxis,
  yAxis: yAxis,
  behavior: "zoomXY"
}));

// Add scrollbars
// https://www.amcharts.com/docs/v5/charts/xy-chart/scrollbars/
chart.set("scrollbarX", am5.Scrollbar.new(root, {
  orientation: "horizontal"
}));

chart.set("scrollbarY", am5.Scrollbar.new(root, {
  orientation: "vertical"
}));

var data = [
  {
    x: 1,
    ay: 6.5,
    by: 2.2,
    aValue: 15,
    bValue: 10
  },
  {
    x: 2,
    ay: 12.3,
    by: 4.9,
    aValue: 8,
    bValue: 3
  },
  {
    x: 3,
    ay: 12.3,
    by: 5.1,
    aValue: 16,
    bValue: 4
  },
  {
    x: 5,
    ay: 2.9,
    aValue: 9
  },
  {
    x: 7,
    by: 8.3,
    bValue: 13
  },
  {
    x: 10,
    ay: 2.8,
    by: 13.3,
    aValue: 9,
    bValue: 13
  },
  {
    x: 12,
    ay: 3.5,
    by: 6.1,
    aValue: 5,
    bValue: 2
  },
  {
    x: 13,
    ay: 5.1,
    aValue: 10
  },
  {
    x: 15,
    ay: 6.7,
    by: 10.5,
    aValue: 3,
    bValue: 10
  },
  {
    x: 16,
    ay: 8,
    by: 12.3,
    aValue: 5,
    bValue: 13
  },
  {
    x: 20,
    by: 4.5,
    bValue: 11
  },
  {
    x: 22,
    ay: 9.7,
    by: 15,
    aValue: 15,
    bValue: 10
  },
  {
    x: 23,
    ay: 10.4,
    by: 10.8,
    aValue: 1,
    bValue: 11
  },
  {
    x: 24,
    ay: 1.7,
    by: 19,
    aValue: 12,
    bValue: 3
  }
];

series0.data.setAll(data);
series1.data.setAll(data);

// Make stuff animate on load
// https://www.amcharts.com/docs/v5/concepts/animations/
series0.appear(1000);
series1.appear(1000);

chart.appear(1000, 100);

}); // end am5.ready()
</script>

<!-- HTML -->
<div id="chartdiv"></div>