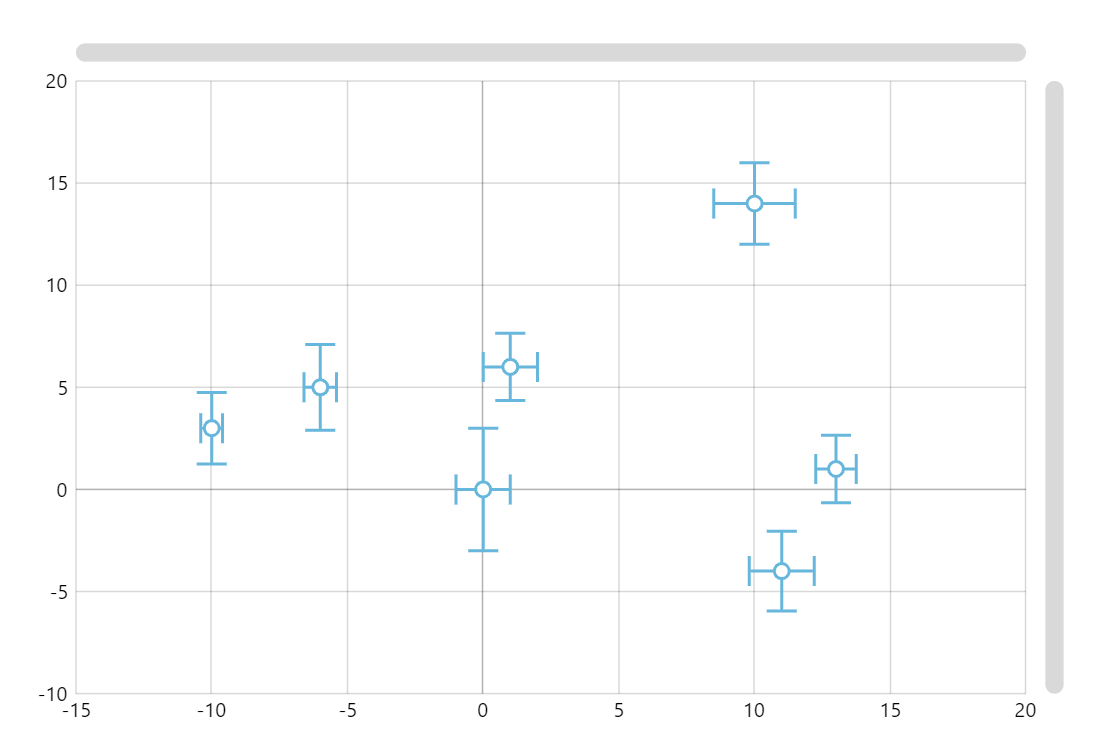
XY Error Chart
Error Charts let us display variability of data in a graphical format. This chart displays the ranges of how far the exact (error-free) value might be from the center point displayed.
Key implementation details
We use the bullets feature to display our data points. In this case we draw a custom bullet using the Graphics element of amCharts and its SVG-like drawing commands.
Related tutorials
Demo source
<!-- Styles -->
<style>
#chartdiv {
  width: 100%;
  height: 500px;
}
</style>

<!-- Resources -->
<script src="https://cdn.amcharts.com/lib/5/index.js"></script>
<script src="https://cdn.amcharts.com/lib/5/xy.js"></script>
<script src="https://cdn.amcharts.com/lib/5/themes/Animated.js"></script>

<!-- Chart code -->
<script>
am5.ready(function() {

var data = [{
  "x": 10,
  "y": 14,
  "errorX": 3,
  "errorY": 4
}, {
  "x": 0,
  "y": 0,
  "errorX": 2,
  "errorY": 6
}, {
  "x": -10,
  "y": 3,
  "errorX": 0.8,
  "errorY": 3.5
}, {
  "x": -6,
  "y": 5,
  "errorX": 1.2,
  "errorY": 4.2
}, {
  "x": 11,
  "y": -4,
  "errorX": 2.4,
  "errorY": 3.9
}, {
  "x": 13,
  "y": 1,
  "errorX": 1.5,
  "errorY": 3.3
}, {
  "x": 1,
  "y": 6,
  "errorX": 2,
  "errorY": 3.3
}];

// Create root element
// https://www.amcharts.com/docs/v5/getting-started/#Root_element
var root = am5.Root.new("chartdiv");

// Set themes
// https://www.amcharts.com/docs/v5/concepts/themes/
root.setThemes([
  am5themes_Animated.new(root)
]);

// Create chart
// https://www.amcharts.com/docs/v5/charts/xy-chart/
var chart = root.container.children.push(am5xy.XYChart.new(root, {
  panX: true,
  panY: true,
  wheelY: "zoomXY",
  pinchZoomX:true,
  pinchZoomY:true
}));

chart.get("colors").set("step", 2);

// Create axes
// https://www.amcharts.com/docs/v5/charts/xy-chart/axes/
var xAxis = chart.xAxes.push(am5xy.ValueAxis.new(root, {
  extraMax: 0.2,
  extraMin: 0.2,
  renderer: am5xy.AxisRendererX.new(root, { minGridDistance: 50 }),
  tooltip: am5.Tooltip.new(root, {})
}));

var yAxis = chart.yAxes.push(am5xy.ValueAxis.new(root, {
  extraMax: 0.2,
  extraMin: 0.2,
  renderer: am5xy.AxisRendererY.new(root, {}),
  tooltip: am5.Tooltip.new(root, {})
}));

// Create series
// https://www.amcharts.com/docs/v5/charts/xy-chart/series/
var series = chart.series.push(am5xy.LineSeries.new(root, {
  calculateAggregates: true,
  xAxis: xAxis,
  yAxis: yAxis,
  valueYField: "y",
  valueXField: "x",
  tooltip: am5.Tooltip.new(root, {
    labelText: "x: {valueX}\ny: {valueY}\nerrorX: {errorX}\nerrorY: {errorY}"
  })
}));

// add error bullet
series.bullets.push(function() {
  var graphics = am5.Graphics.new(root, {
    strokeWidth: 2,
    stroke: series.get("stroke"),
    draw: function(display, target) {
      var dataItem = target.dataItem;
      var errorX = dataItem.dataContext.errorX;

      var xPosition0 = xAxis.valueToPosition(0);
      var xPosition1 = xAxis.valueToPosition(errorX);

      var width = (xAxis.get("renderer").positionToCoordinate(xPosition1) - xAxis.get("renderer").positionToCoordinate(xPosition0)) / 2;

      display.moveTo(-width, 0);
      display.lineTo(width, 0);

      display.moveTo(-width, -10);
      display.lineTo(-width, 10);

      display.moveTo(width, -10);
      display.lineTo(width, 10);

      var errorY = dataItem.dataContext.errorY;

      var yPosition0 = yAxis.valueToPosition(0);
      var yPosition1 = yAxis.valueToPosition(errorY);

      var height = (yAxis.get("renderer").positionToCoordinate(yPosition1) - yAxis.get("renderer").positionToCoordinate(yPosition0)) / 2;

      display.moveTo(0, -height);
      display.lineTo(0, height);

      display.moveTo(-10, -height);
      display.lineTo(10, -height);

      display.moveTo(-10, height);
      display.lineTo(10, height);
    }
  });

  return am5.Bullet.new(root, {
    dynamic: true,
    sprite: graphics
  });
});

// Add circle bullet
// https://www.amcharts.com/docs/v5/charts/xy-chart/series/#Bullets
series.bullets.push(function() {
  var graphics = am5.Circle.new(root, {
    strokeWidth: 2,
    radius: 5,
    stroke: series.get("stroke"),
    fill: root.interfaceColors.get("background"),
  });
  return am5.Bullet.new(root, {
    sprite: graphics
  });
});

series.strokes.template.set("strokeOpacity", 0);

// Add cursor
// https://www.amcharts.com/docs/v5/charts/xy-chart/cursor/
chart.set("cursor", am5xy.XYCursor.new(root, {
  xAxis: xAxis,
  yAxis: yAxis,
  snapToSeries: [series]
}));

// Add scrollbars
// https://www.amcharts.com/docs/v5/charts/xy-chart/scrollbars/
chart.set("scrollbarX", am5.Scrollbar.new(root, {
  orientation: "horizontal"
}));

chart.set("scrollbarY", am5.Scrollbar.new(root, {
  orientation: "vertical"
}));

series.data.setAll(data);

// Make stuff animate on load
// https://www.amcharts.com/docs/v5/concepts/animations/
series.appear(1000);
chart.appear(1000, 100);

}); // end am5.ready()
</script>

<!-- HTML -->
<div id="chartdiv"></div>