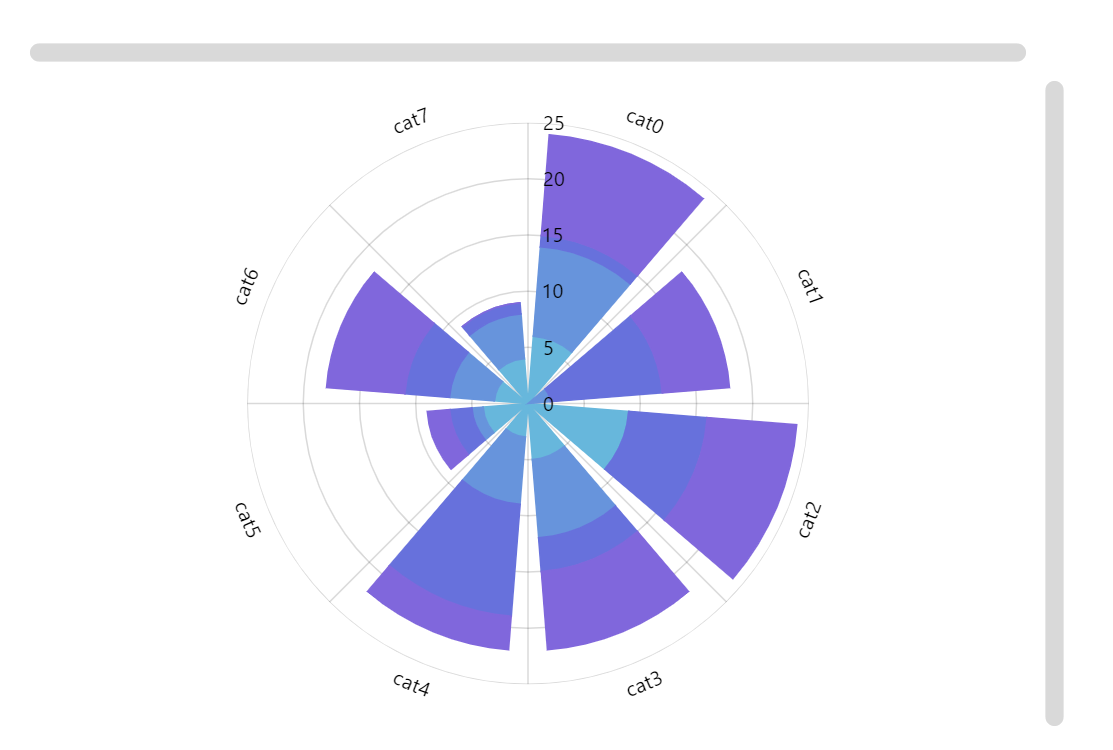
Zoomable Radar
This demo shows all the ways to enable zooming in a radar chart.
Key implementation details
First of all, we enable zooming with a mouse wheel right when we create the chart by setting wheelY: "zoomX". This way rotating mouse wheel zooms across the chart’s X axis (the circular one). Then we add a cursor and set its behavior to zoomX as well. Finally, we add both scrollbarX and scrollbarY – controlling zooming is their default behavior, so there’s nothing extra you need to do.
Related tutorials
Demo source
<!-- Styles -->
<style>
#chartdiv {
  width: 100%;
  height: 600px;
}
</style>

<!-- Resources -->
<script src="https://cdn.amcharts.com/lib/5/index.js"></script>
<script src="https://cdn.amcharts.com/lib/5/xy.js"></script>
<script src="https://cdn.amcharts.com/lib/5/radar.js"></script>
<script src="https://cdn.amcharts.com/lib/5/themes/Animated.js"></script>

<!-- Chart code -->
<script>
am5.ready(function() {

// Create root element
// https://www.amcharts.com/docs/v5/getting-started/#Root_element
var root = am5.Root.new("chartdiv");

// Set themes
// https://www.amcharts.com/docs/v5/concepts/themes/
root.setThemes([
  am5themes_Animated.new(root)
]);

// Generate and set data
// https://www.amcharts.com/docs/v5/charts/radar-chart/#Setting_data
var cat = -1;
var value = 10;

function generateData() {
  value = Math.round(Math.random() * 10);
  cat++;
  return {
    category: "cat" + cat,
    value: value
  };
}

function generateDatas(count) {
  cat = -1;
  var data = [];
  for (var i = 0; i < count; ++i) {
    data.push(generateData());
  }
  return data;
}

// Create chart
// https://www.amcharts.com/docs/v5/charts/radar-chart/
var chart = root.container.children.push(am5radar.RadarChart.new(root, {
  panX: false,
  panY: false,
  wheelX: "panX",
  wheelY: "zoomX"
}));

// Add cursor
// https://www.amcharts.com/docs/v5/charts/radar-chart/#Cursor
var cursor = chart.set("cursor", am5radar.RadarCursor.new(root, {
  behavior: "zoomX"
}));

cursor.lineY.set("visible", false);

// Create axes and their renderers
// https://www.amcharts.com/docs/v5/charts/radar-chart/#Adding_axes
var xRenderer = am5radar.AxisRendererCircular.new(root, {});
xRenderer.labels.template.setAll({
  radius: 10
});

var xAxis = chart.xAxes.push(am5xy.CategoryAxis.new(root, {
  maxDeviation: 0,
  categoryField: "category",
  renderer: xRenderer,
  tooltip: am5.Tooltip.new(root, {})
}));

var yAxis = chart.yAxes.push(am5xy.ValueAxis.new(root, {
  renderer: am5radar.AxisRendererRadial.new(root, {})
}));

// Create series
// https://www.amcharts.com/docs/v5/charts/radar-chart/#Adding_series
for (var i = 0; i < 4; i++) {
  var series = chart.series.push(am5radar.RadarColumnSeries.new(root, {
    stacked: true,
    name: "Series " + i,
    xAxis: xAxis,
    yAxis: yAxis,
    valueYField: "value",
    categoryXField: "category"
  }));

  series.columns.template.setAll({
    tooltipText: "{name}: {valueY}"
  });

  series.data.setAll(generateDatas(8));

  series.appear(1000);
}

// Add scrollbars
chart.set("scrollbarX", am5.Scrollbar.new(root, { orientation: "horizontal" }));
chart.set("scrollbarY", am5.Scrollbar.new(root, { orientation: "vertical" }));

var data = generateDatas(8);
xAxis.data.setAll(data);

// Animate chart
// https://www.amcharts.com/docs/v5/concepts/animations/#Initial_animation
chart.appear(1000, 100);

}); // end am5.ready()
</script>

<!-- HTML -->
<div id="chartdiv"></div>