Zoomable Value Axis
Zoomable in any direction
The chart can support zooming in any direction. For that it has two settings: scrollbarX and scrollbarY. Both can be set with an instance of a Scrollbar, and configured individually.
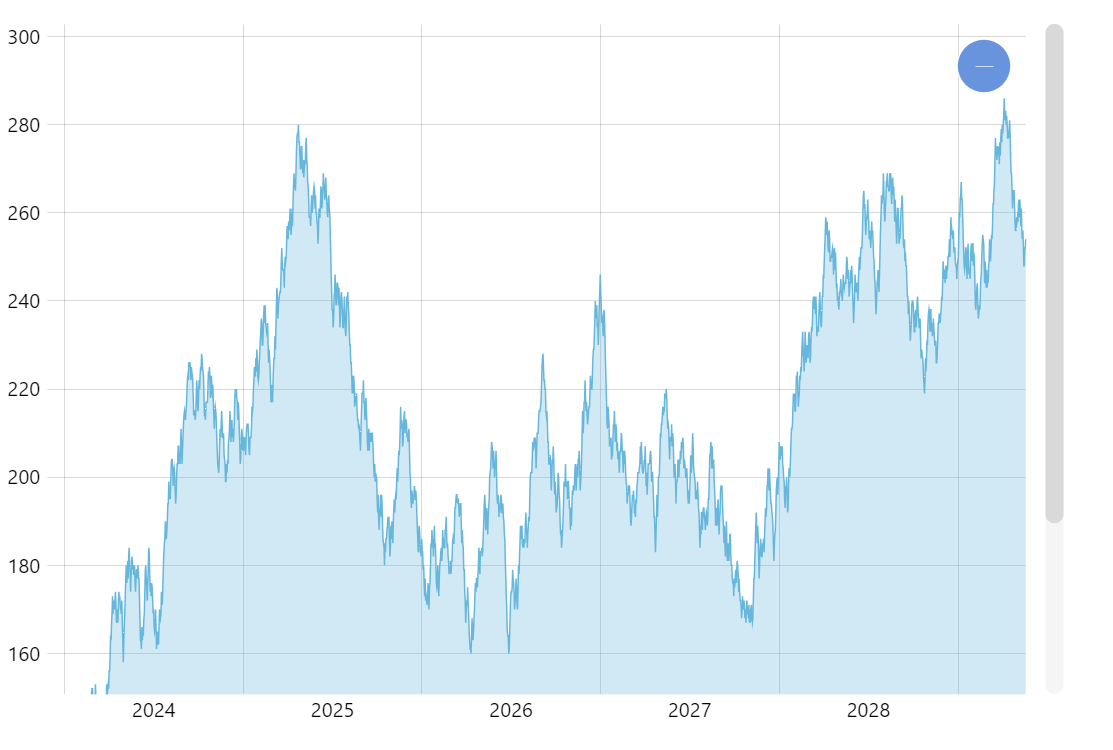
Zooming with cursor
Chart cursor can be set up to perform a plethora of tasks. In this demo we have set cursor’s behavior to "zoomY" which means that cursor will select and zoom vertically.
Demo source
<!-- Styles -->
<style>
#chartdiv {
  width: 100%;
  height: 500px;
}
</style>

<!-- Resources -->
<script src="https://cdn.amcharts.com/lib/5/index.js"></script>
<script src="https://cdn.amcharts.com/lib/5/xy.js"></script>
<script src="https://cdn.amcharts.com/lib/5/themes/Animated.js"></script>

<!-- Chart code -->
<script>
am5.ready(function() {


// Create root element
// https://www.amcharts.com/docs/v5/getting-started/#Root_element
var root = am5.Root.new("chartdiv");

// Set themes
// https://www.amcharts.com/docs/v5/concepts/themes/
root.setThemes([
  am5themes_Animated.new(root)
]);

// Create chart
// https://www.amcharts.com/docs/v5/charts/xy-chart/
var chart = root.container.children.push(
  am5xy.XYChart.new(root, {
    panX: false,
    panY: false,
    wheelX: "panX",
    wheelY: "zoomY",
    paddingLeft: 0
  })
);

// Add cursor
// https://www.amcharts.com/docs/v5/charts/xy-chart/cursor/
var cursor = chart.set("cursor", am5xy.XYCursor.new(root, {
  behavior: "zoomY"
}));
cursor.lineX.set("visible", false);

// Generate random data
var date = new Date();
date.setHours(0, 0, 0, 0);
var value = 100;

function generateData() {
  value = Math.round(Math.random() * 10 - 5 + value);

  am5.time.add(date, "day", 1);
  return { date: date.getTime(), value: value };
}

function generateDatas(count) {
  var data = [];
  for (var i = 0; i < count; ++i) {
    data.push(generateData());
  }
  return data;
}

// Create axes
// https://www.amcharts.com/docs/v5/charts/xy-chart/axes/
var xAxis = chart.xAxes.push(
  am5xy.DateAxis.new(root, {
    baseInterval: { timeUnit: "day", count: 1 },
    renderer: am5xy.AxisRendererX.new(root, {
      minorGridEnabled: true,
      minGridDistance: 70
    }),
    tooltip: am5.Tooltip.new(root, {})
  })
);

var yAxis = chart.yAxes.push(
  am5xy.ValueAxis.new(root, {
    renderer: am5xy.AxisRendererY.new(root, {})
  })
);

// Add series
// https://www.amcharts.com/docs/v5/charts/xy-chart/series/
var series = chart.series.push(
  am5xy.LineSeries.new(root, {
    name: "Series",
    xAxis: xAxis,
    yAxis: yAxis,
    valueYField: "value",
    valueXField: "date",
    tooltip: am5.Tooltip.new(root, {
      labelText: "{valueY}"
    })
  })
);

series.fills.template.setAll({ fillOpacity: 0.3, visible: true });

// Add scrollbar
// https://www.amcharts.com/docs/v5/charts/xy-chart/scrollbars/
var scrollbar = chart.set("scrollbarY", am5.Scrollbar.new(root, {
  orientation: "vertical"
}));

var data = generateDatas(2000);
series.data.setAll(data);

// Make stuff animate on load
// https://www.amcharts.com/docs/v5/concepts/animations/
series.appear(1000);
chart.appear(1000, 100);

}); // end am5.ready()
</script>

<!-- HTML -->
<div id="chartdiv"></div>