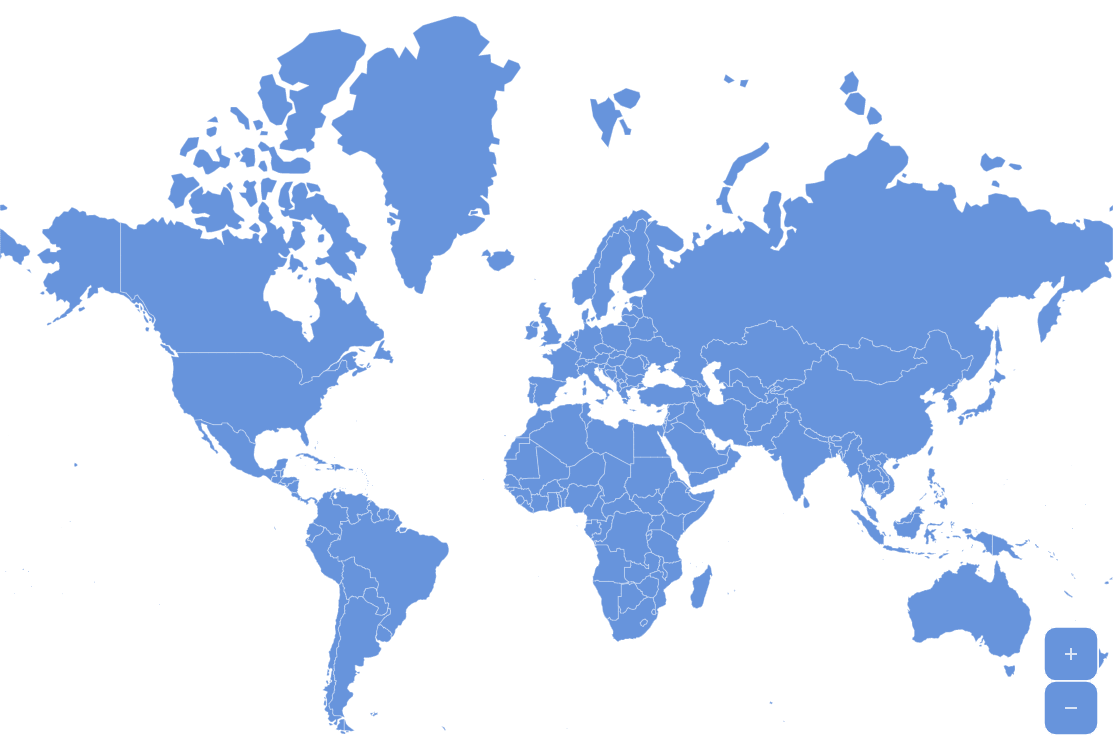
Zooming to Countries Map
Showing a high-level map and then zooming in to a specific country on user’s click is a very common scenario. And it’s very easy to implement in amCharts Maps.
Key implementation details
All we need to do is react to the active event on map polygons and the call the zoomToDataItem() method.
Related tutorials
Demo source
<!-- Styles -->
<style>
#chartdiv {
  width: 100%;
  height: 500px;
}
</style>

<!-- Resources -->
<script src="https://cdn.amcharts.com/lib/5/index.js"></script>
<script src="https://cdn.amcharts.com/lib/5/map.js"></script>
<script src="https://cdn.amcharts.com/lib/5/geodata/worldLow.js"></script>
<script src="https://cdn.amcharts.com/lib/5/themes/Animated.js"></script>

<!-- Chart code -->
<script>
am5.ready(function() {

// Create root element
// https://www.amcharts.com/docs/v5/getting-started/#Root_element
var root = am5.Root.new("chartdiv");


// Set themes
// https://www.amcharts.com/docs/v5/concepts/themes/
root.setThemes([
  am5themes_Animated.new(root)
]);


// Create the map chart
// https://www.amcharts.com/docs/v5/charts/map-chart/
var chart = root.container.children.push(am5map.MapChart.new(root, {
  panX: "translateX",
  panY: "translateY",
  projection: am5map.geoMercator()
}));


// Create main polygon series for countries
// https://www.amcharts.com/docs/v5/charts/map-chart/map-polygon-series/
var polygonSeries = chart.series.push(am5map.MapPolygonSeries.new(root, {
  geoJSON: am5geodata_worldLow,
  exclude: ["AQ"]
}));

polygonSeries.mapPolygons.template.setAll({
  tooltipText: "{name}",
  toggleKey: "active",
  interactive: true
});

polygonSeries.mapPolygons.template.states.create("hover", {
  fill: root.interfaceColors.get("primaryButtonHover")
});

polygonSeries.mapPolygons.template.states.create("active", {
  fill: root.interfaceColors.get("primaryButtonHover")
});

var previousPolygon;

polygonSeries.mapPolygons.template.on("active", function (active, target) {
  if (previousPolygon && previousPolygon != target) {
    previousPolygon.set("active", false);
  }
  if (target.get("active")) {
    polygonSeries.zoomToDataItem(target.dataItem );
  }
  else {
    chart.goHome();
  }
  previousPolygon = target;
});


// Add zoom control
// https://www.amcharts.com/docs/v5/charts/map-chart/map-pan-zoom/#Zoom_control
var zoomControl = chart.set("zoomControl", am5map.ZoomControl.new(root, {}));
zoomControl.homeButton.set("visible", true);

// Set clicking on "water" to zoom out
chart.chartContainer.get("background").events.on("click", function () {
  chart.goHome();
})


// Make stuff animate on load
chart.appear(1000, 100);

}); // end am5.ready()
</script>

<!-- HTML -->
<div id="chartdiv"></div>