Pie Chart
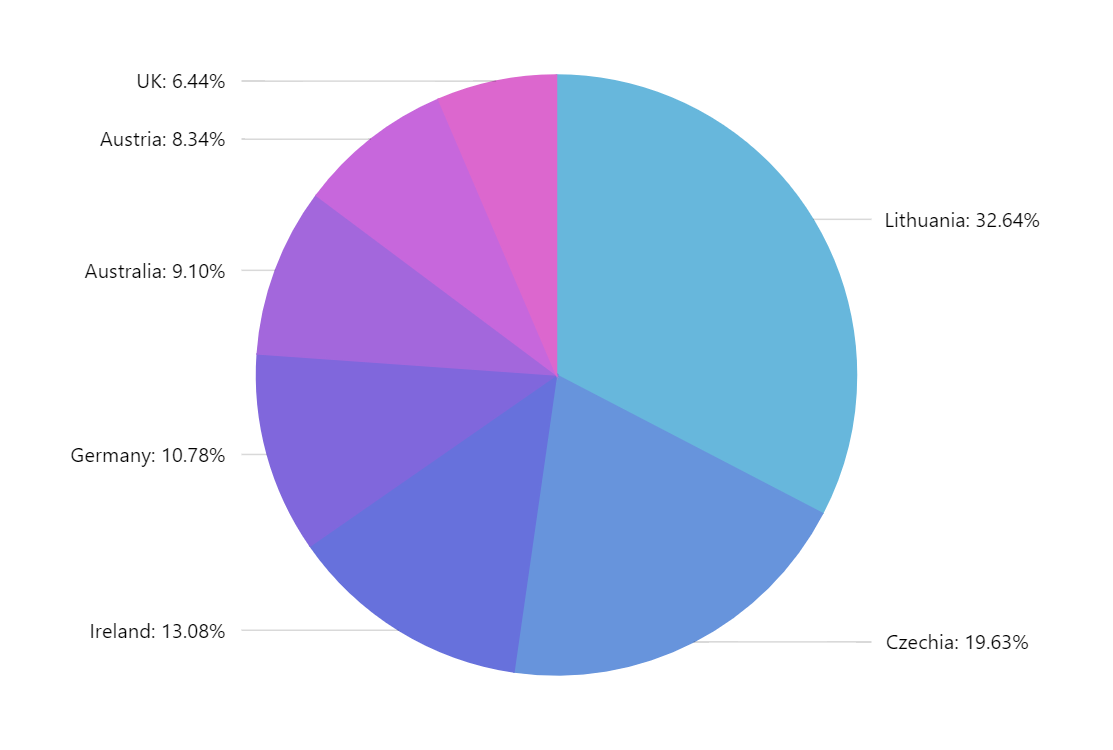
Pie charts are the most commonly used chart type to represent qualitative data (values in relation to the whole). amCharts has an extensive support for various pie chart sub-types and configuration options. This demo shows the most basic and commonly used implementation of pie chart.
Key implementation details
We create an instance of PieChart and add PieSeries to it with data fields configured. And that’s all you need to do to add this type of pie chart in your web app.
Related tutorials
Demo source
<!-- Styles -->
<style>
#chartdiv {
  width: 100%;
  height: 500px;
}
</style>

<!-- Resources -->
<script src="https://cdn.amcharts.com/lib/5/index.js"></script>
<script src="https://cdn.amcharts.com/lib/5/percent.js"></script>
<script src="https://cdn.amcharts.com/lib/5/themes/Animated.js"></script>

<!-- Chart code -->
<script>
am5.ready(function() {

// Create root element
// https://www.amcharts.com/docs/v5/getting-started/#Root_element
var root = am5.Root.new("chartdiv");

// Set themes
// https://www.amcharts.com/docs/v5/concepts/themes/
root.setThemes([
  am5themes_Animated.new(root)
]);

// Create chart
// https://www.amcharts.com/docs/v5/charts/percent-charts/pie-chart/
var chart = root.container.children.push(
  am5percent.PieChart.new(root, {
    endAngle: 270
  })
);

// Create series
// https://www.amcharts.com/docs/v5/charts/percent-charts/pie-chart/#Series
var series = chart.series.push(
  am5percent.PieSeries.new(root, {
    valueField: "value",
    categoryField: "category",
    endAngle: 270
  })
);

series.states.create("hidden", {
  endAngle: -90
});

// Set data
// https://www.amcharts.com/docs/v5/charts/percent-charts/pie-chart/#Setting_data
series.data.setAll([{
  category: "Lithuania",
  value: 501.9
}, {
  category: "Czechia",
  value: 301.9
}, {
  category: "Ireland",
  value: 201.1
}, {
  category: "Germany",
  value: 165.8
}, {
  category: "Australia",
  value: 139.9
}, {
  category: "Austria",
  value: 128.3
}, {
  category: "UK",
  value: 99
}]);

series.appear(1000, 100);

}); // end am5.ready()
</script>

<!-- HTML -->
<div id="chartdiv"></div>