New V3.16 with revamped touch controls, crisp-clear icons released
We’re happy to announce that we just released a new milestone Version 3.16 across all amCharts products.
If you’re using amCharts CDN, you’re already set. If you’re hosting your own libraries, grab the update from Downloads (free version) or Support area (commercial versions).
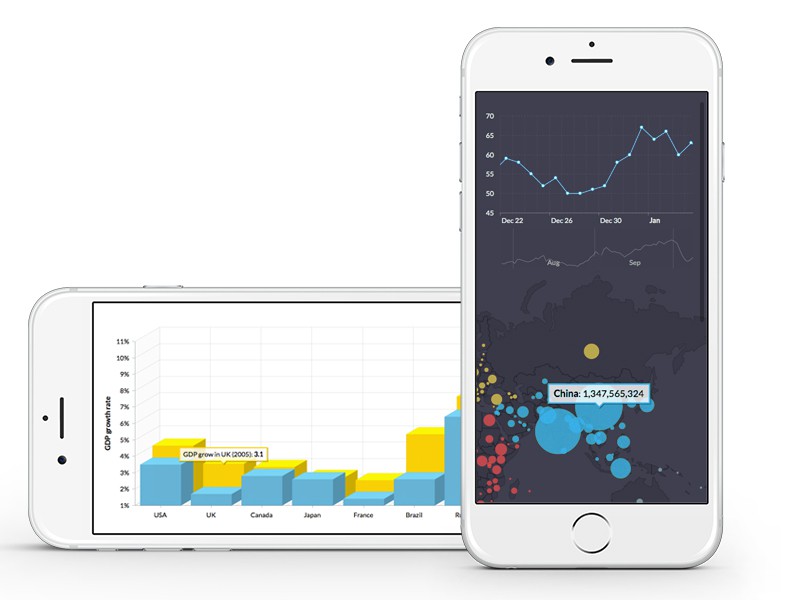
Revamped touch device support
The most notable change is a completely revamped touch device support. You’ll notice the improved handling on mobiles ant tables immediately. Now, the chart will not block you from swipe-scrolling or pinch-zooming the whole page. You will still be able to “tap into” a chart or map to enable internal pan or zoom inside it. “Tap outside” and you regain back your page control.
Regular tap events, like interacting with legend, clicking on chart items, etc. will not require tapping into the chart. They will work on first tap.

Mouse controls are not affected by this change in any way.
Crisper icons through SVG
We got rid of the PNG images. Now icons – magnifying glass, scrollbar grips, etc. – are pure homegrown SVG, ensuring the crystal clear appearance on all those Retina displays.
Naturally, non-SVG browsers will fall back to PNGs.
Complete change log
- Charts now use SVG icons for scrollbar, zoom-out and others (IE8 keep using PNG). This makes icons look good on retina displays on all resolutions. New AmChart property svgIconswith default value true was created. If you want PNG icons to be used all the time, set this property to false.
- Default value of zoomOutButtonImage of AmRectangularChart changed to lens. If svgIcons is set to true (default) .svg will be added to the file name if SVG is supported by the browser, otherwise – .png.
- Chart behavior on touch events improved.
- tapToActivate property added to AmChart, with default value true. This is our new approach to solve issues with scrolling of a page on touch devices. Charts which require gestures like swipe (charts with scrollbar/cursor) or pinch (maps) used to prevent regular page scrolling and could result page to stick to the same spot if the chart occupied whole screen. Now, in order these gestures to start working user has to touch the chart/maps once. Regular touch events like touching on the bar/slice/map area do not require the first tap and will show balloons and perform other tasks as usual. If you have a map or chart which occupies full screen and your page does not require scrolling, set tapToActivate to false – this will bring old behavior back.
- leaveAfterTouch property added to ChartCursor and ChartCursorSettings with default value true. This makes cursor and balloons to remain after user touches the chart.
- We changed default value of fixedPosition of AmBalloon to true. We think this brings a better usability for touch devices. This results roll-over balloon to point to a fixed position of a slice/column/bullet instead of following the mouse. Note, AmMap overrides fixedPosition to false, as countries are of a irregular shape and it’s quite often that middle point of a country is outside the country itself.
- showBullet property added to StockEvent, with default value false. If you set it to true, the data point will display both event and regular (if set) bullet.
- recalculateValue added to StockGraph. Possible values are Open, Close, High, Low, Average and Sum. There is no default value set – graph uses it’s periodValue when calculating changes. For example, the graph’s periodValue is Close. This means that when data is grouped to longer periods (months for example) when recalculating, the graph will use Closevalue of the first period of the selection as base value and will compare each months Close value to it. If you set recalculateValue to Open, the first value of a month will be used as base value.
- Second attribute, skipEvents added to validateNow method of AmStockChart.
- autoDisplay property added to AmChart with default value false. If you set it to true the chart will automatically monitor changes of display style of chart’s container (or any of it’s parents) and will render chart correctly if it is changed from none to block. We recommend setting it to true if you change this style at a run time, as it affects performance a bit.
- Bug fix: roll-over balloon could hide under legend if legend position was right or left.
- Bug fix: if chart has more graphs than colors in colors array of a chart, graph’s color was chosen automatically. The problem was that this color was chose each time user hid/showed the graph.
- Bug fix: setting font sizes using CSS not worked properly in some cases.
- Bug fix: chart’s title ignored bold = false setting and always showed bold title.