Volume Profile Indicator
What is it?
The Volume Profile indicator or Volume-by-price is a tool used in technical analysis to illustrate the distribution of trading volume across different price levels during a specified period.
Instead of focusing solely on price movements, the Volume Profile displays horizontal bars along the side of the price chart, with each bar representing the volume traded at a specific price level. Traders use this information to identify key support and resistance levels, as well as areas of high or low trading activity.
Peaks in the Volume Profile can indicate significant price levels, while valleys may suggest areas with lighter trading interest. By incorporating volume data, the Volume Profile helps traders gain insights into market sentiment and potential price reversals, contributing to more informed trading decisions.
amCharts implementation
Starting with version 5.7.0 amCharts 5: Stock Chart has a Volume Profile Indicator built-in.
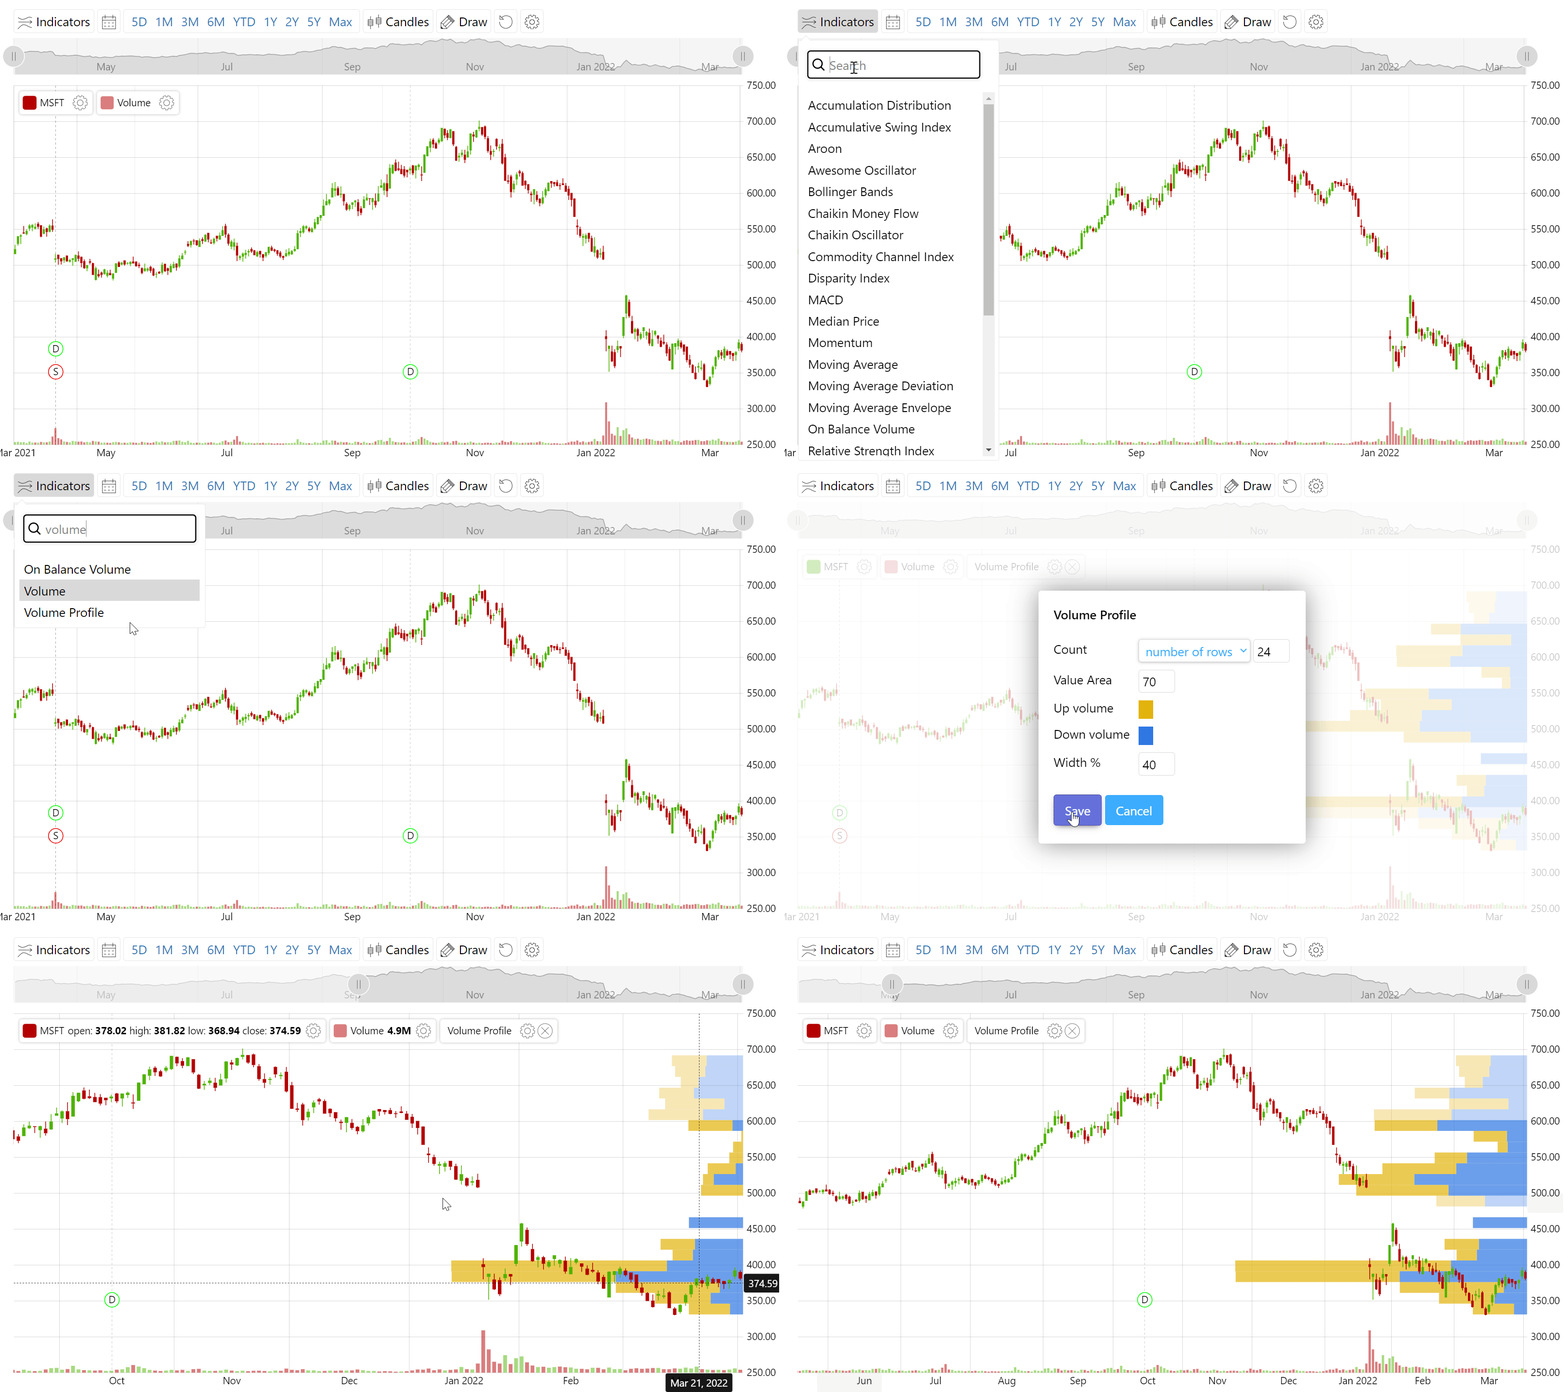
To add it, simply select it from the Indicators control.

Configuring
amCharts’ implementation of Volume Profile allows configuring it in a number of ways:
- Users can set separate colors for volume down and up periods.
- Configure the area of the value – the pricing area where most of trading volume occurred.
- Width of the volume chart.
- And most importantly select the way price ranges are calculated: either in fixed number of steps or specific increments, e.g. number of cents.
Legend
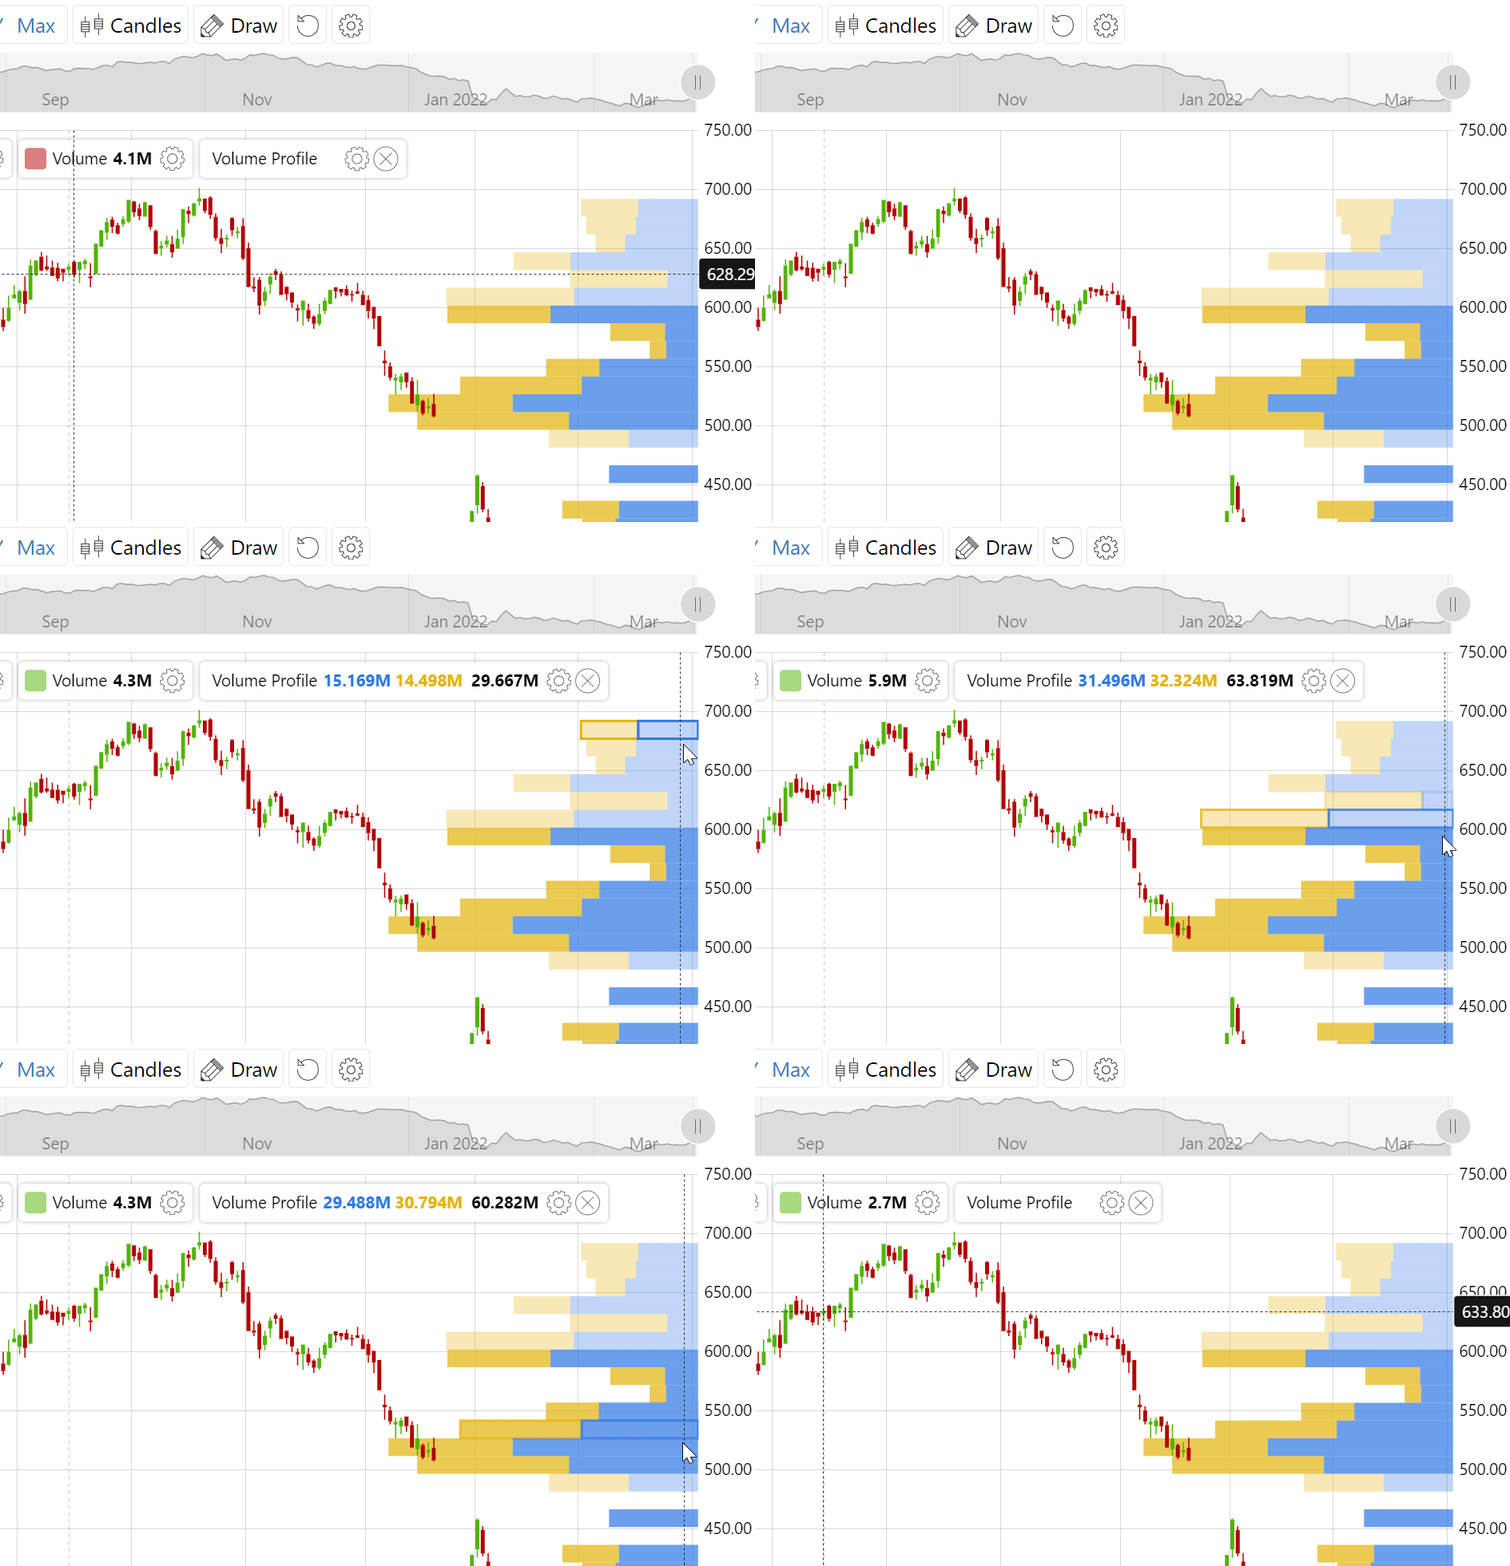
As with other amCharts indicators, Volume Profile comes with full legend support, which shows price range volume information on hover.

API
Volume Profile indicator can also be added via Stock Chart’s API:
var volumeProfile = stockChart.indicators.push(am5stock.VolumeProfile.new(root, {
  stockChart: stockChart,
  stockSeries: valueSeries,
  volumeSeries: volumeSeries,
  legend: valueLegend
}));
Demo
[codepen_embed height=”800″ default_tab=”result” slug_hash=”RwvXLXL” user=”amcharts”]See the Pen
Stock Chart with Volume Profile Indicator by amCharts team (@amcharts)
on CodePen.[/codepen_embed]