Describe what you want. AI builds it. Browse hundreds of demos — each one includes an AI prompt ready to copy into Claude, ChatGPT, Gemini, or any tool you use.
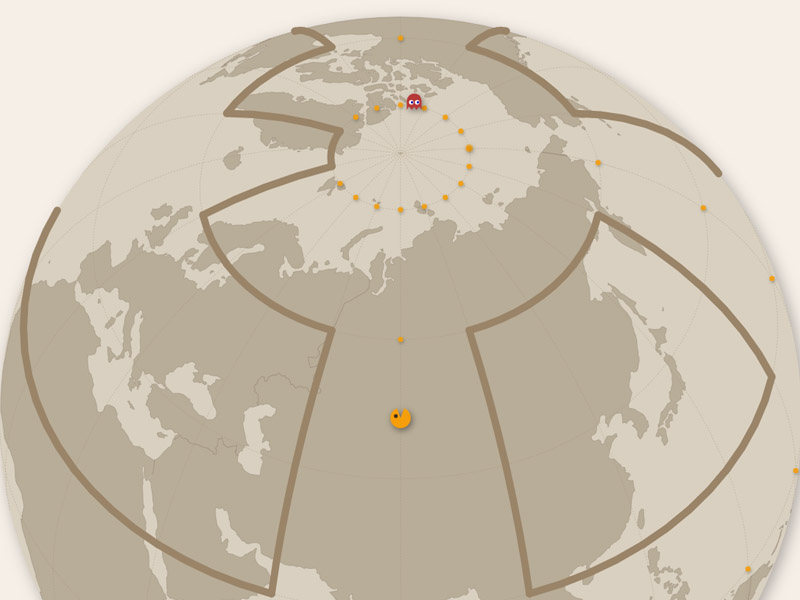
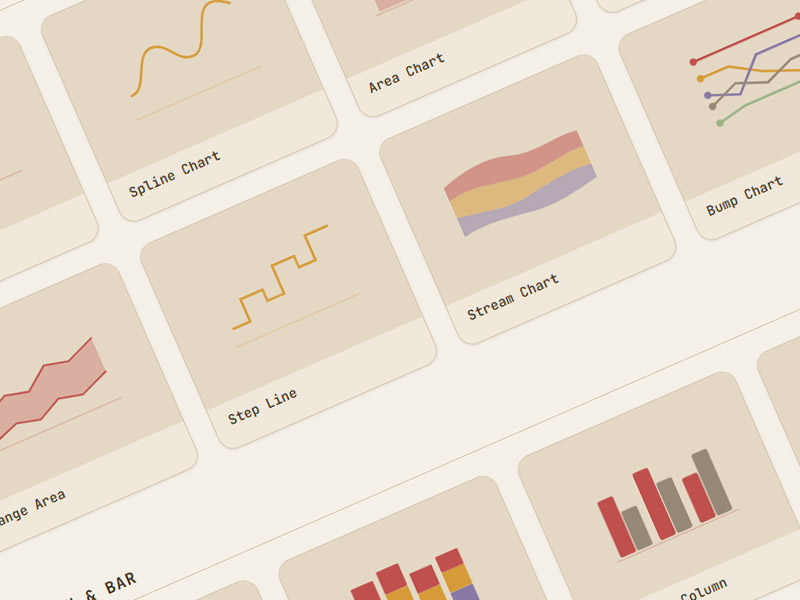
AI can build anything you can describe, as long as the library goes deep enough. You describe what you want and get working code, from the same objects and the same API it uses for a bar chart. Every part of an amCharts chart is a live object: a column, an axis label, a map region, a tooltip. Read it, restyle it, animate it, or draw your own shapes and animations on top, in the same coordinates as your data. You get the freedom of building from scratch, without the edge cases that come with it: resizing, touch and zoom, accessibility, export, time zones, large data. The globe at the top of our homepage is one: a map of the Earth that turns into a talking face, in plain amCharts.
Choose the approach that fits your workflow.
The fastest way to start. Open Claude, ChatGPT, or Gemini in your browser. Paste this into any AI chat to get accurate amCharts 5 code:
Connect the amCharts MCP Server and your AI gets instant access to the docs, code examples and the full API reference. Point it at our hosted server — nothing to install, always the latest version.
Prefer to run it yourself? It's also available as a local npm install.
Building your own tools? Enable web search in the Claude, OpenAI, or Gemini API and drop our skill file into the system prompt for structured chart creation.
Connect the amCharts MCP server to your code editor. Your AI assistant gets structured, on-demand access to the docs, code examples and the full API reference. Use our hosted server for a zero-install setup that always runs the latest version, or run it locally via npm. Works with Claude Code, Cursor, Windsurf, VS Code Copilot, and any MCP-compatible tool.
A structured reference file you drop into your project root. AI coding tools that read project files pick it up, with no server setup. Contains chart type recipes, common patterns, and API shortcuts.
From version 5.21.0 the npm package and the download carry their own notes for AI coding agents: AGENTS.md, a docs/ folder with a reference for every chart type, and examples/ with working code. They always match the version you have installed. Add these lines to your project's own AGENTS.md or CLAUDE.md, and your agent reads them before it writes chart code.
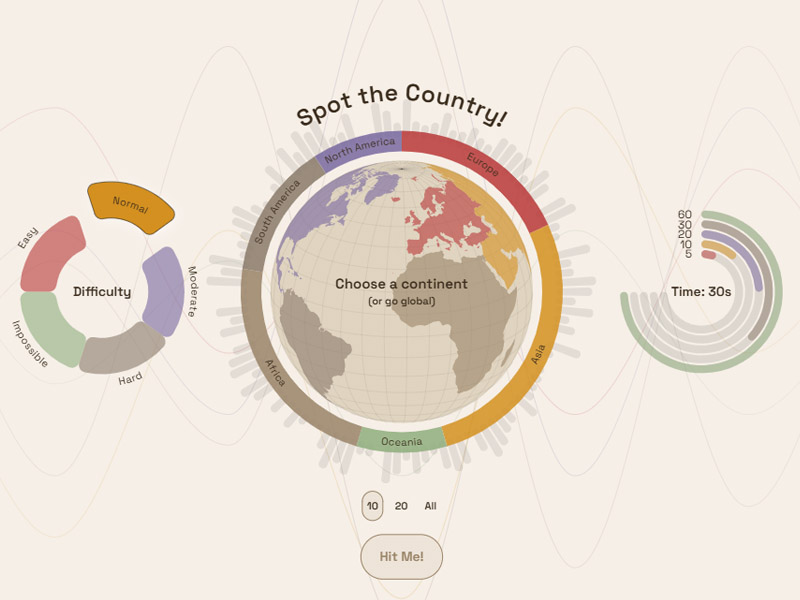
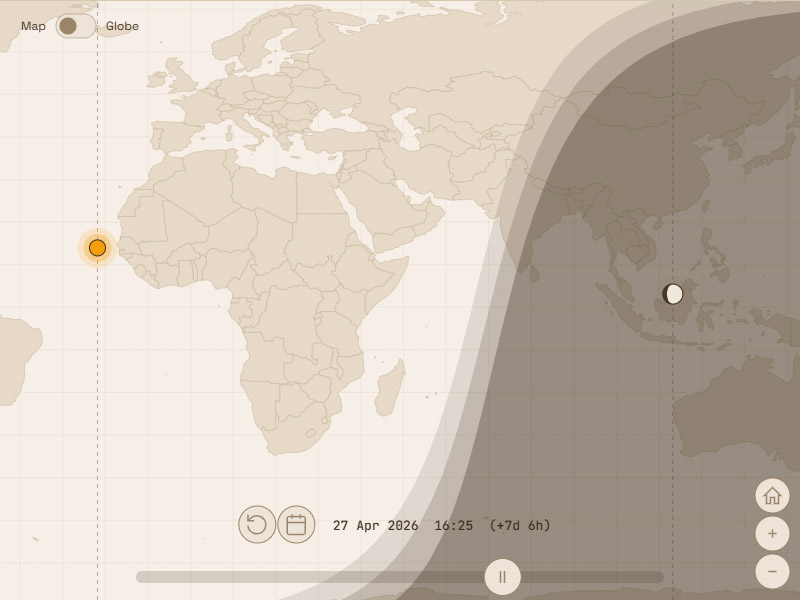
Interactive tools and experiments from the DataViz Dojo — generated by AI, powered by amCharts 5.
Custom chart design, complex dashboards, full-stack integration — from the team that wrote amCharts. Talk to our team