Build interactive charts and maps, generate SVG and pixel maps, or download 427 ready-made maps. Right in your browser.
Or make a map · pick another tool · see pricing
Free to start · no signup to try
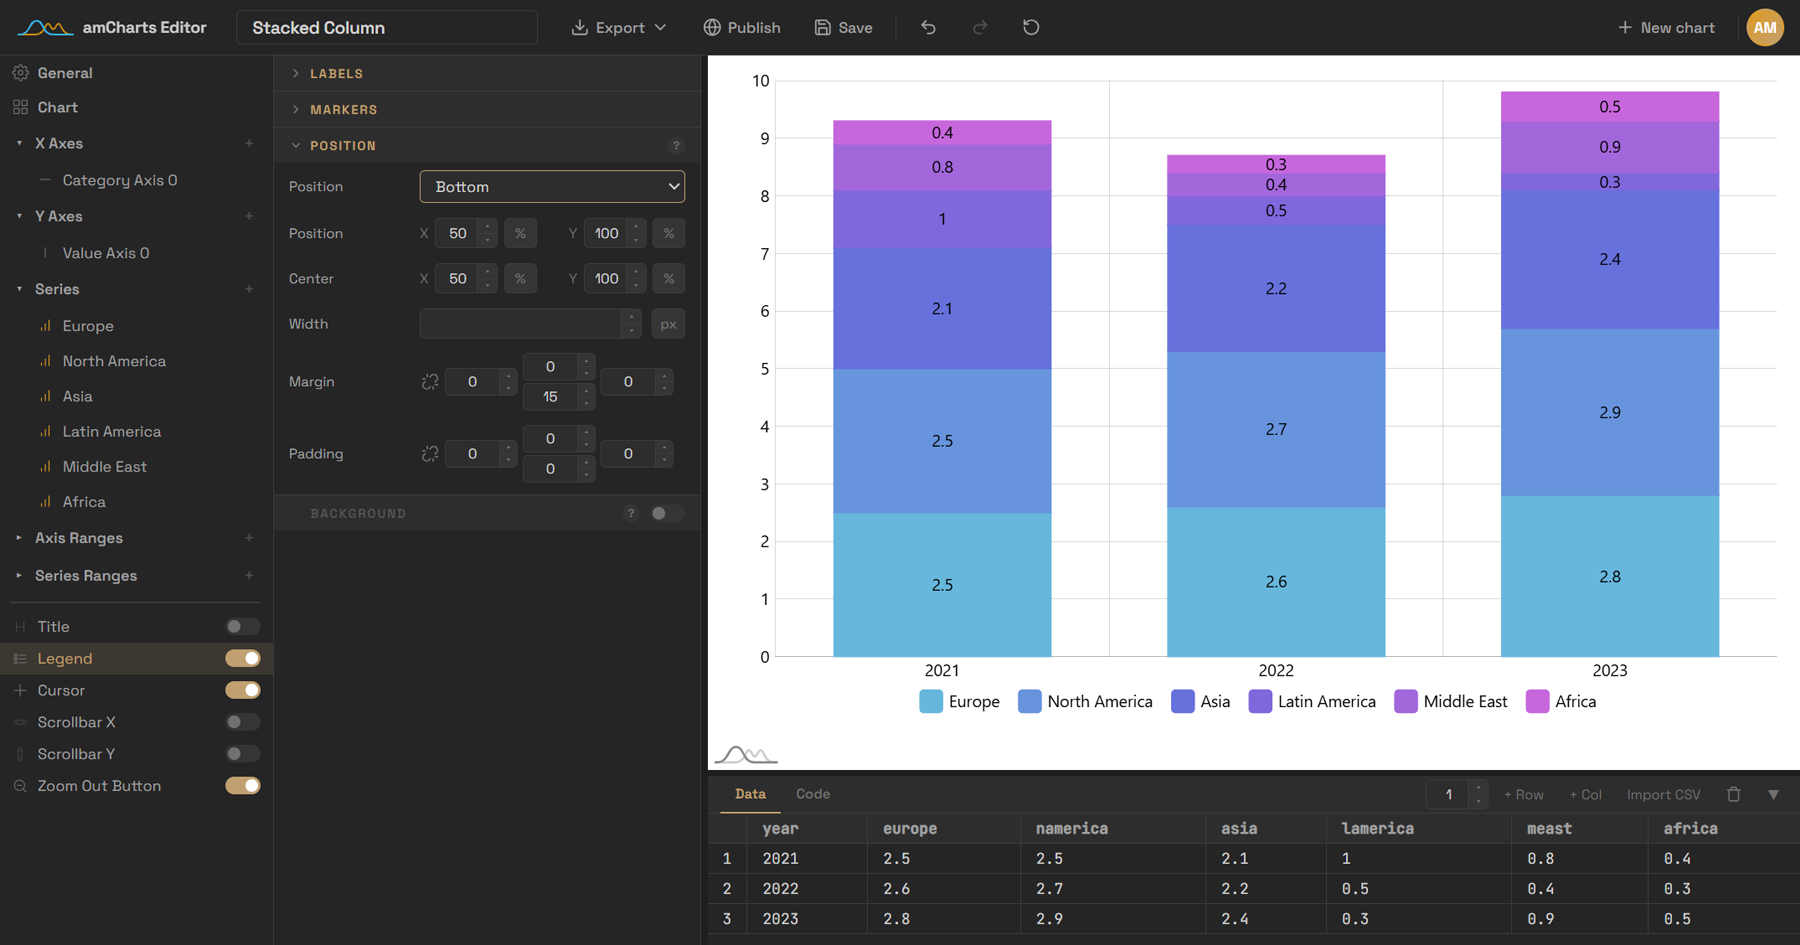
Pick one of 60+ templates, paste your data and style everything point-and-click. Export PNG, SVG, HTML or JSON, or publish and embed it with Chart Maker Pro.
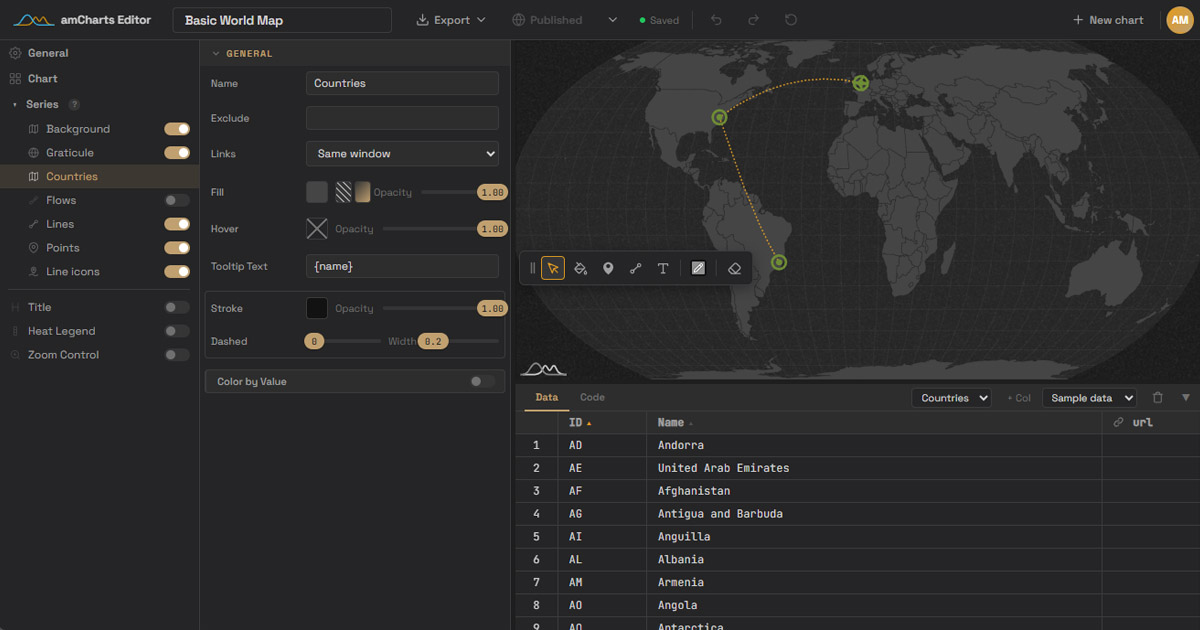
Settings on the left, live chart in the middle, your data underneath.
Color countries by value, drop pins with labels, draw routes and flows, and send planes along them. The drawing tools sit right on the map.
Part of Chart Maker: same account, same Pro plan.
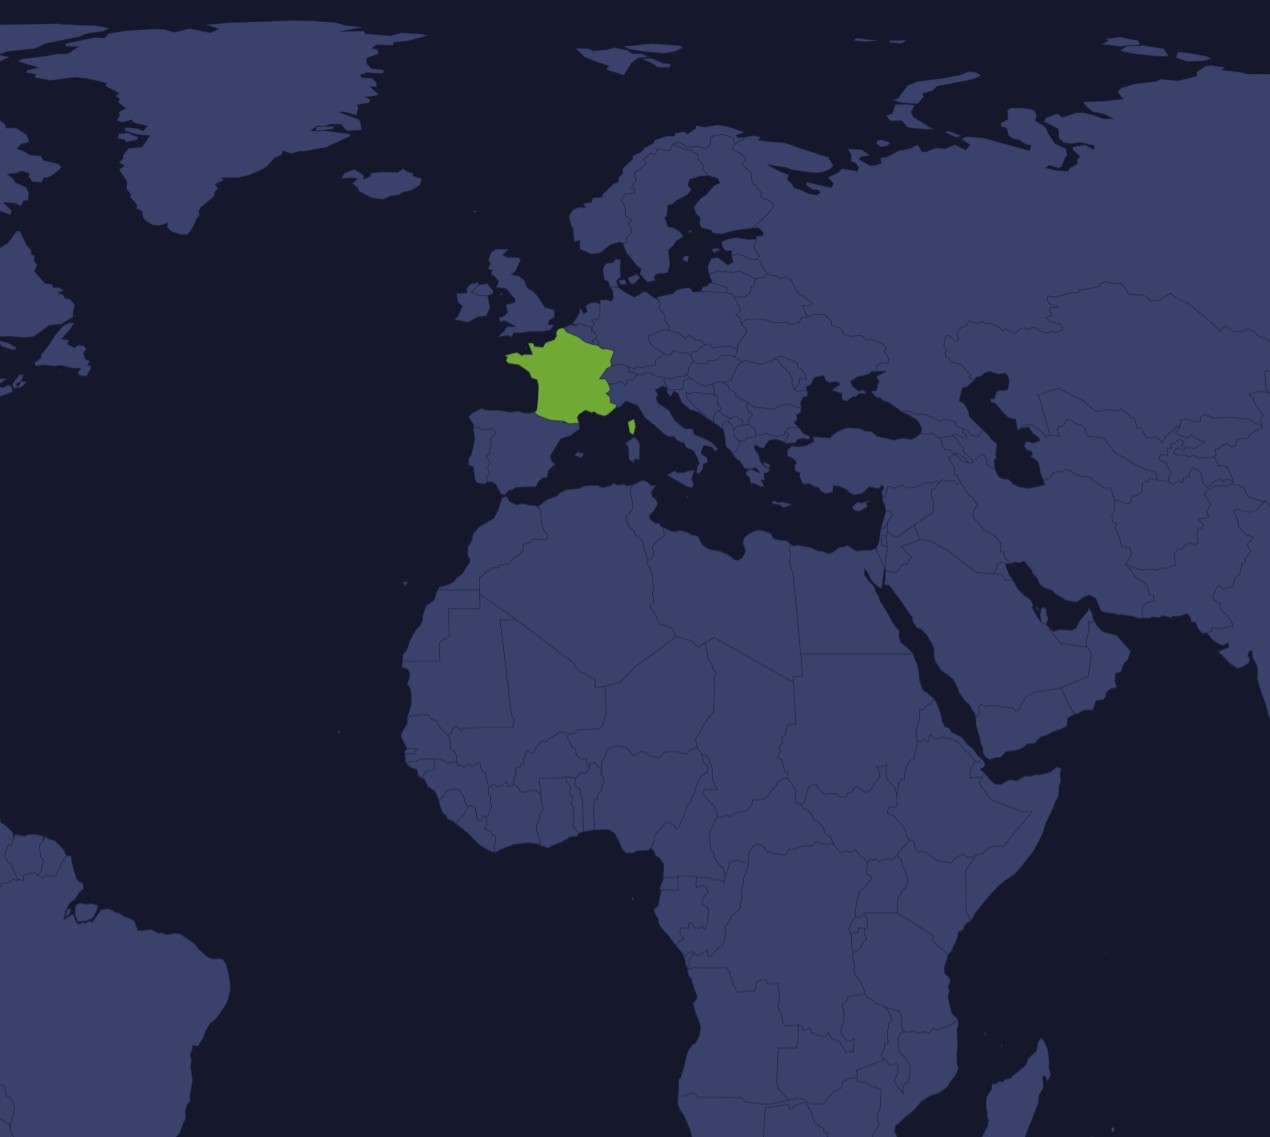
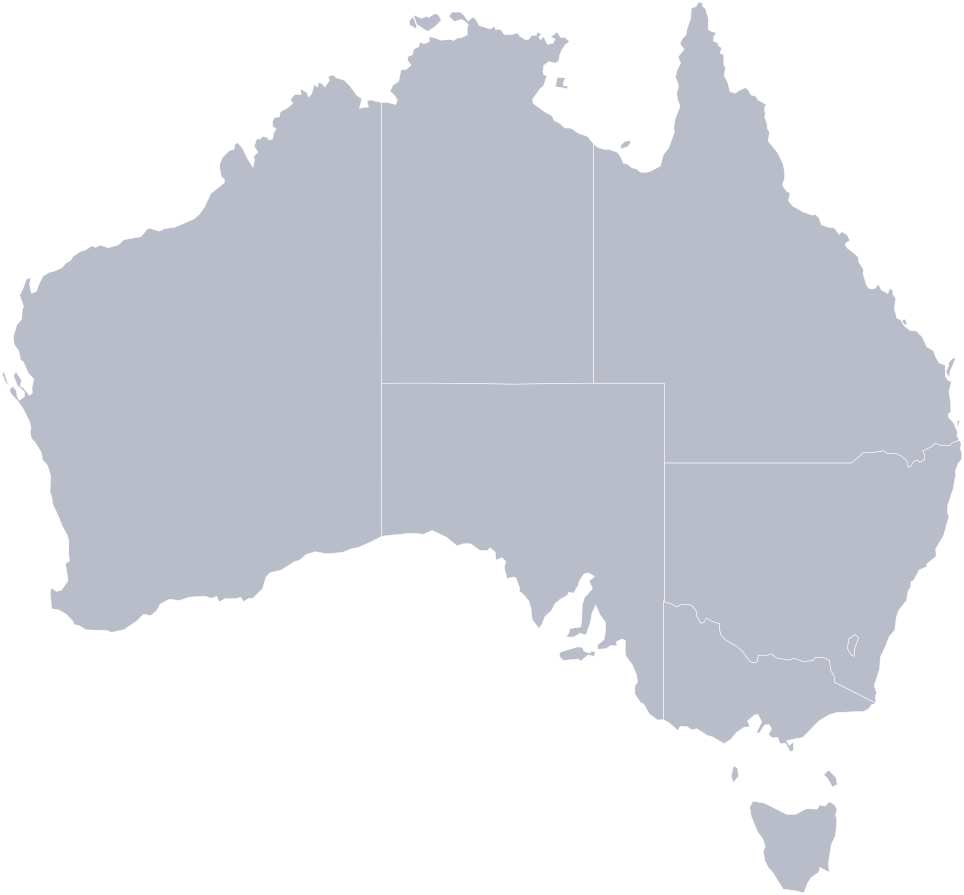
Pick a map, choose a projection, simplify the shapes and color regions by hand. Download an SVG ready for Figma, Illustrator or print, or a PNG for slides.
Output is plain SVG with one path per region, named by ISO code.
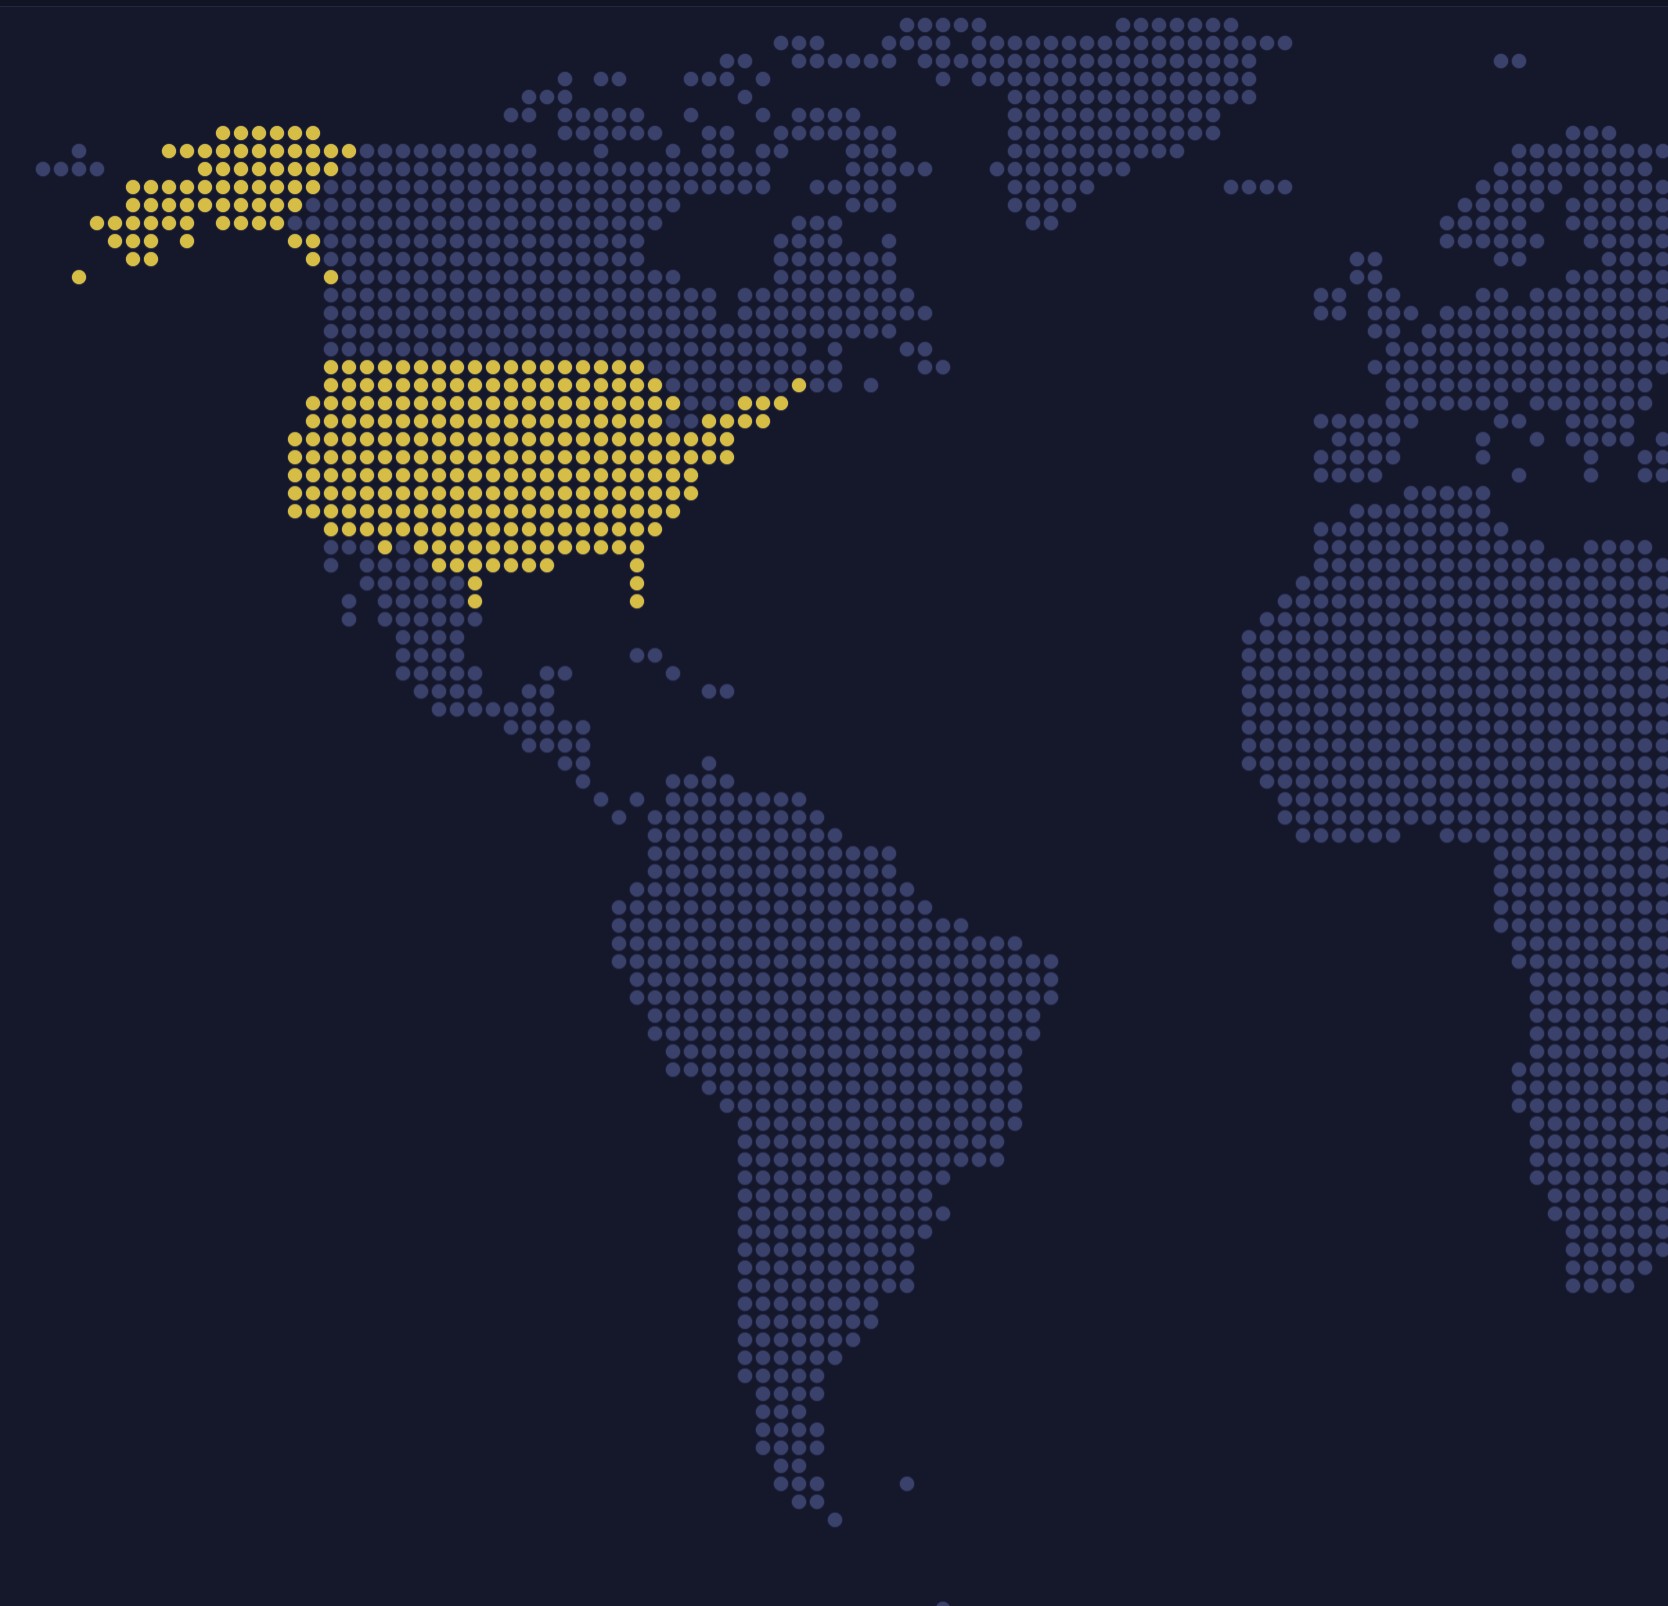
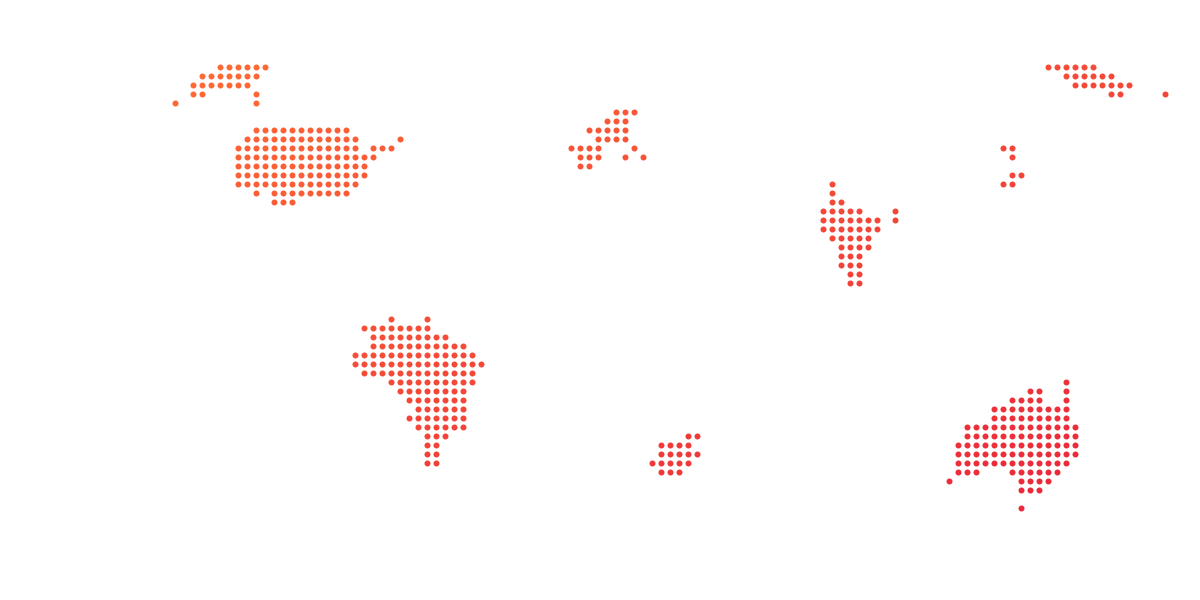
Turn any map into dots, squares, hexagons or diamonds. Set the size and the gap, paint countries in your own colors, then export.
The look used on this page, made in a couple of minutes.
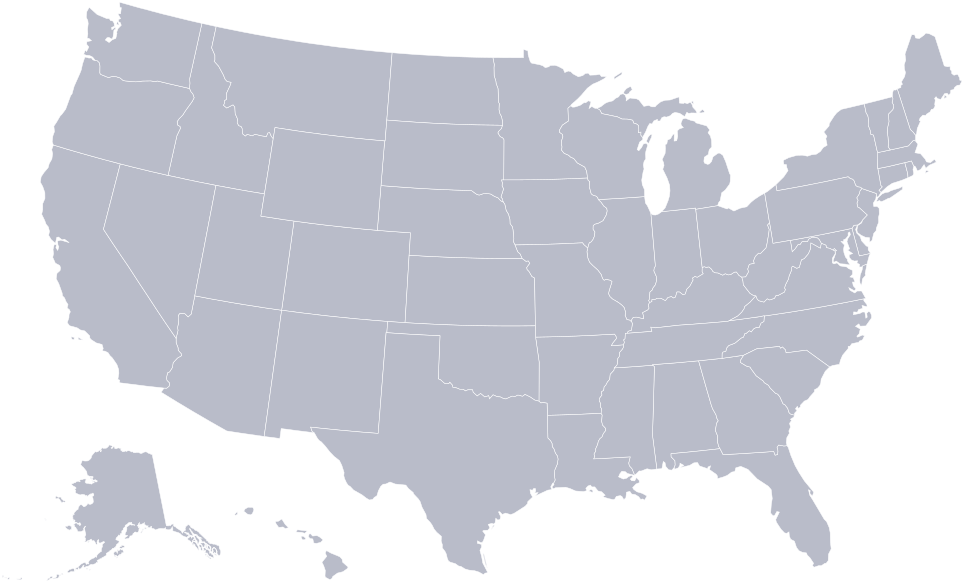
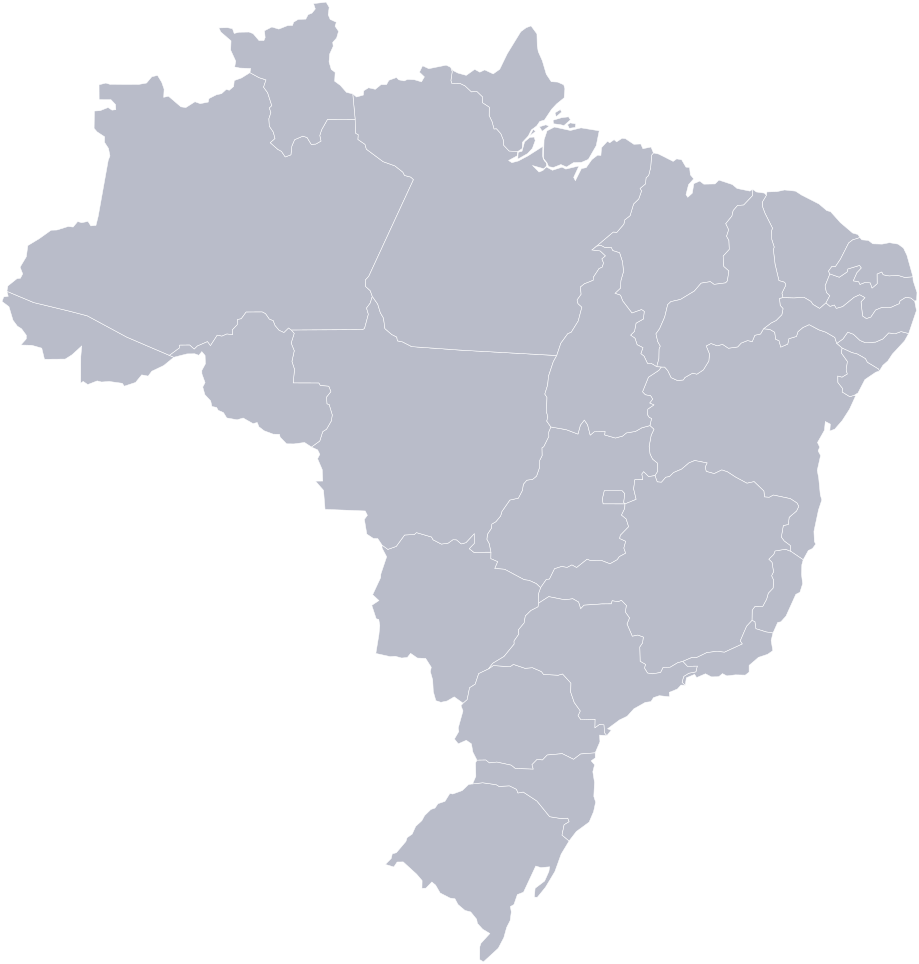
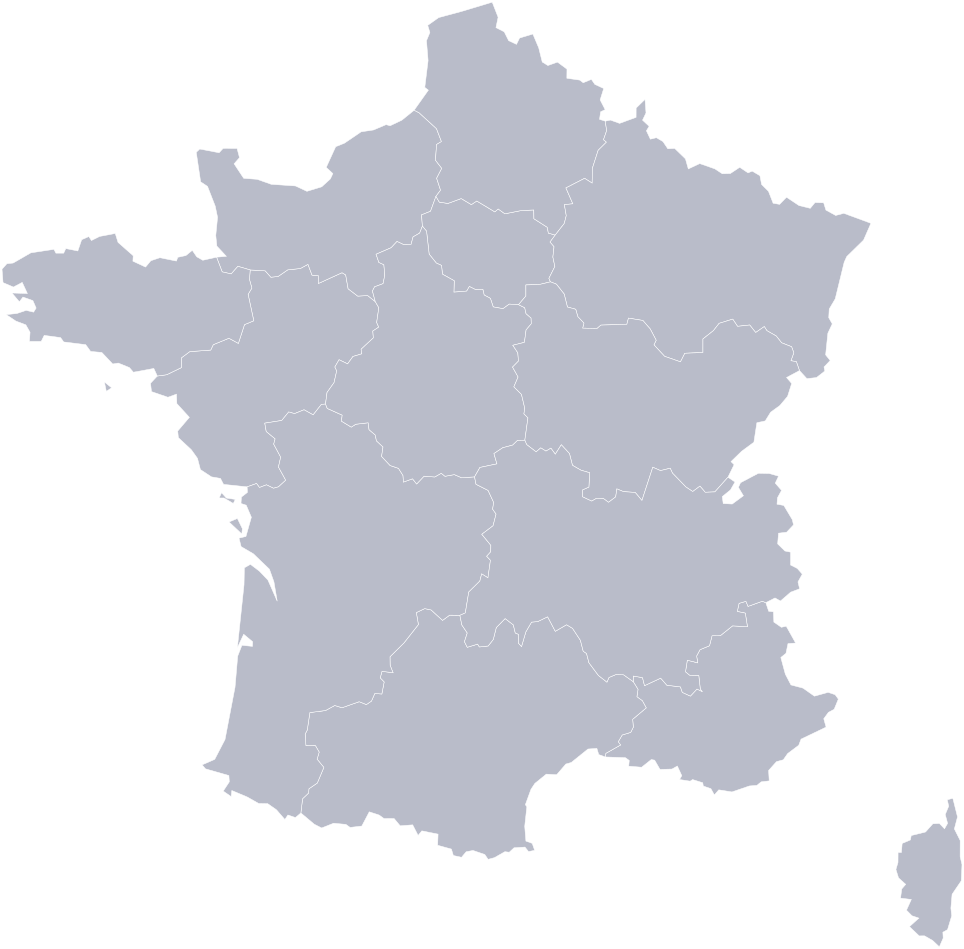
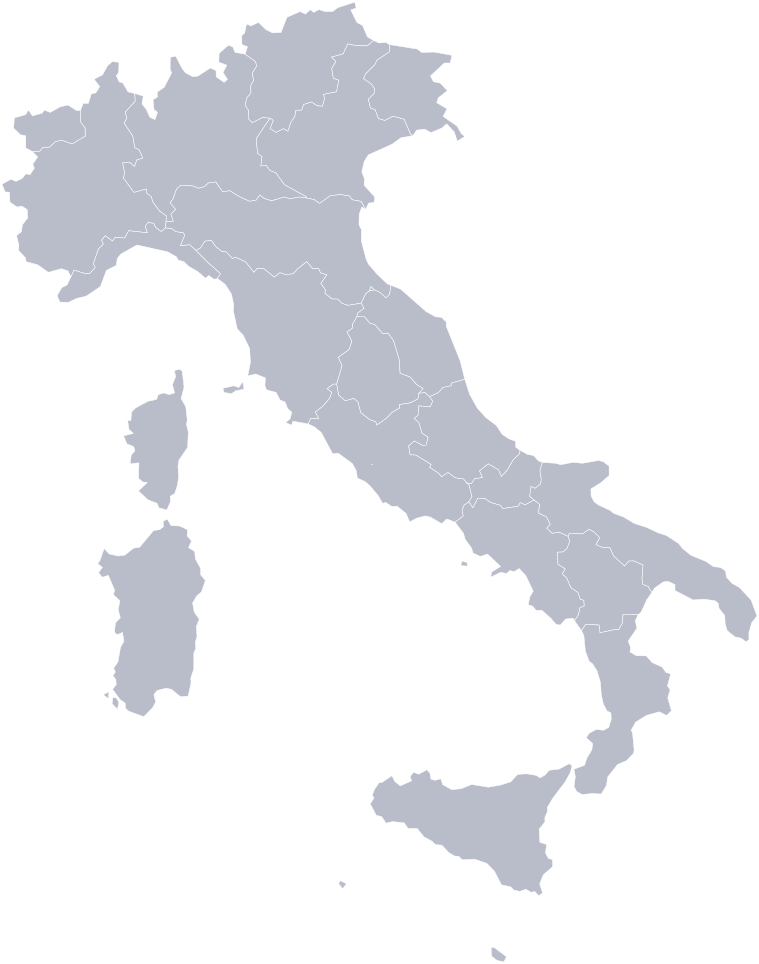
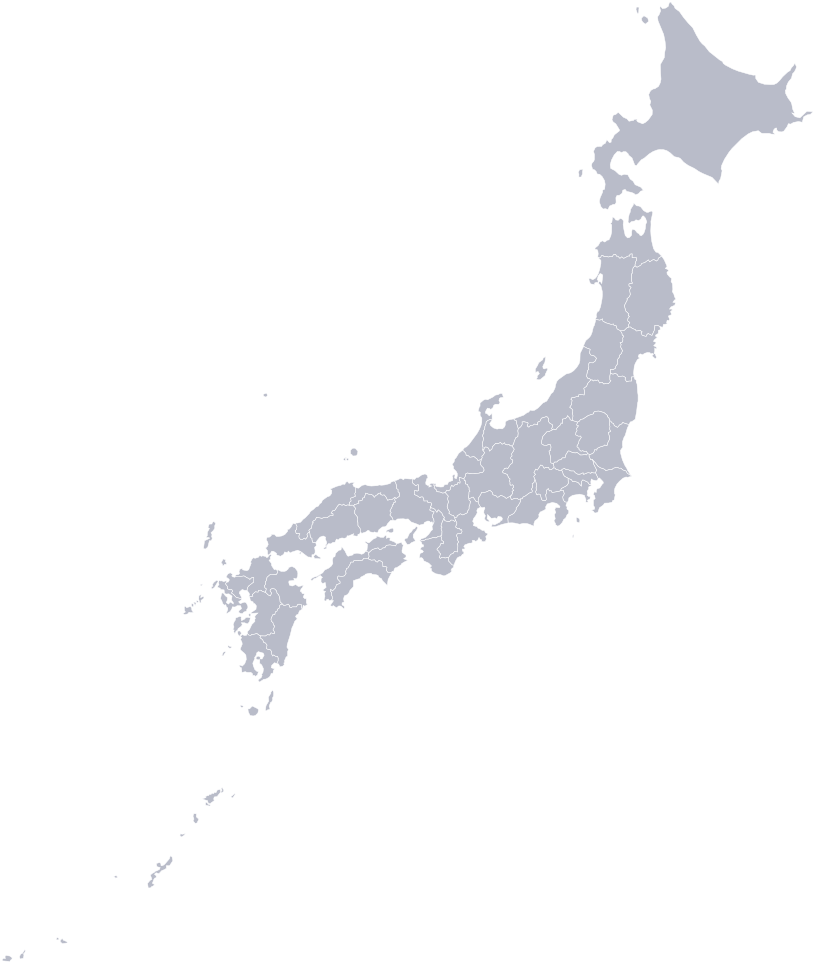
World, continents, countries, states and regions, each in high and low detail. Every region is its own path, named and coded, ready to style.
Free for any use, commercial projects included, as long as you credit amCharts.
No developer, no install, no learning curve. If you can use a slide editor, you can use these.
Every tool, template and export is free. Chart Maker Pro adds room and publishing.
Every tool, with a cap on how much you keep saved in Chart Maker.
Everything in Free, plus room and publishing. Cancel anytime.
Building charts into your own software? The JavaScript library is licensed separately: library licenses.
Not to try. Open any tool and start. A free account lets you save your work; Pro lets you publish it.
Yes, for free, as long as you credit amCharts (CC BY 4.0). Maps exported from the generators and Chart Maker keep the credit. Using the ready-made SVG maps without the credit is a separate purchase, which covers all SVG maps.
The tools are for making charts and maps yourself, in the browser. The library is for developers building charts into their own software, and is licensed separately. A chart from Chart Maker is a standard amCharts 5 config, so a developer can carry on from it in code.
Nothing gets deleted. Your work stays saved and editable. Published pages stay online for a 30-day grace period.
Always. Export any chart or map as PNG, SVG, HTML or JSON, or download your whole account as a ZIP.
Your work is private until you publish it. We collect the minimum needed to run the service and never sell it.