Insanely flexible and blindingly fast: 60+ chart types, Canvas or SVG rendering and a TypeScript-first API. Free to use, even in commercial projects.
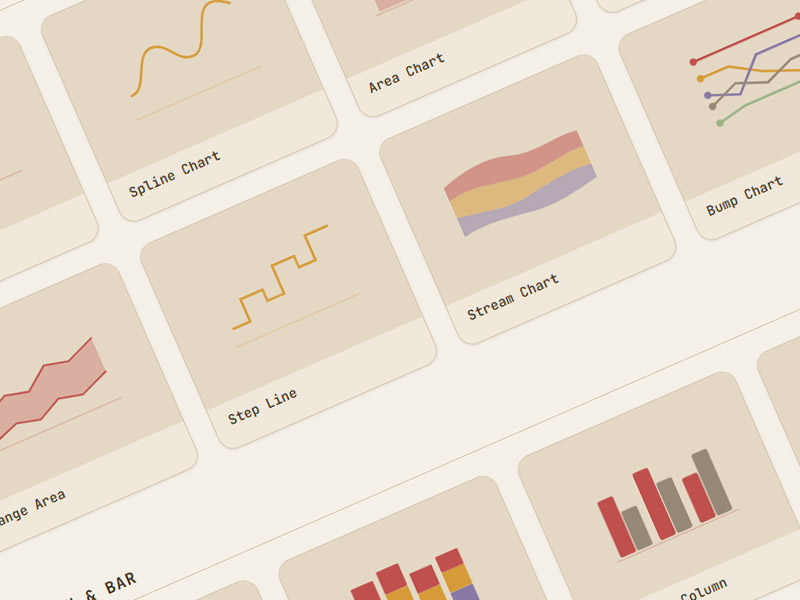
From simple bar charts to complex hierarchical visualizations, amCharts 5 covers all standard and exotic chart types in a single package.
Scroll through a century of daily data points. Pinch to zoom. Notice anything? No stutter. No frame drops. No loading spinners. That's Canvas rendering with automatic data grouping — amCharts intelligently aggregates data at each zoom level so every interaction feels instant.
Go ahead — zoom in to see individual days, zoom out to see yearly trends. Data grouping switches resolution automatically, so a century of days stays smooth.
amCharts doesn't just draw charts — it gives you a full interactive canvas. Multiple chart instances share a single root, communicate through events, and stay silky smooth.
Drag a slice from one pie to the other. This isn't a demo trick — it's how amCharts works. Every element is draggable, clickable, animatable. Your imagination is the limit.
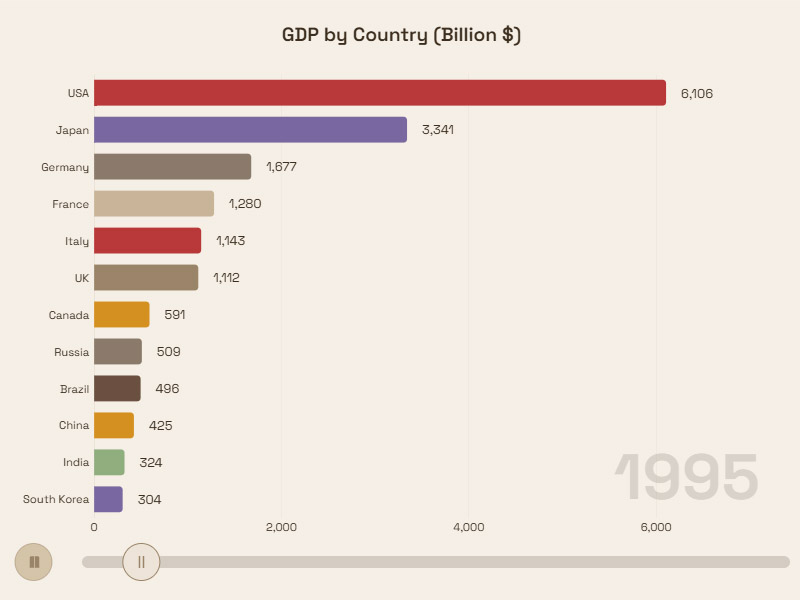
Data visualization isn't just numbers on a screen — it's a narrative. amCharts gives you the tools to make your data speak: radial layouts, heat rules, interactive drill-downs, and animations that guide the viewer's eye.
Click any month on this radar chart to zoom in and explore weekly cycling activity. Watch the smooth animation as the chart reshapes itself around your selection.
Serpentine timelines, Sankey diagrams, chord charts, force-directed trees, Voronoi diagrams, pictorial charts, sunburst hierarchies — amCharts goes far beyond the usual bar-and-line fare, all in one package.
This serpentine timeline bends a standard XY chart into a winding path — perfect for project roadmaps, historical timelines, and process flows. All built with the same API you already know.
Select any part, change it, animate it.
Sprites, shapes, images and paths that move with the chart.
Twenty years of layout, browser and device quirks, already solved.
GPU-accelerated Canvas rendering, or SVG with one setting. Turbo mode for column-heavy charts. ~400KB tree-shakeable core.
Written in TypeScript. Full IDE autocompletion. Every property typed and documented.
Built-in theme engine with smooth animated transitions. States, tooltips, and interactions that feel native.
Screen readers, keyboard navigation, ARIA attributes, high-contrast modes. WCAG AA ready out of the box.
React, Angular, Vue, Svelte, Next.js, Nuxt, Remix, vanilla JS. Integration guides for every major framework. Or skip the setup code: the <am5-chart> element builds a chart from a JSON config, in any of them.
44 built-in locales. RTL support. Every date, number, and currency format. Configure once.
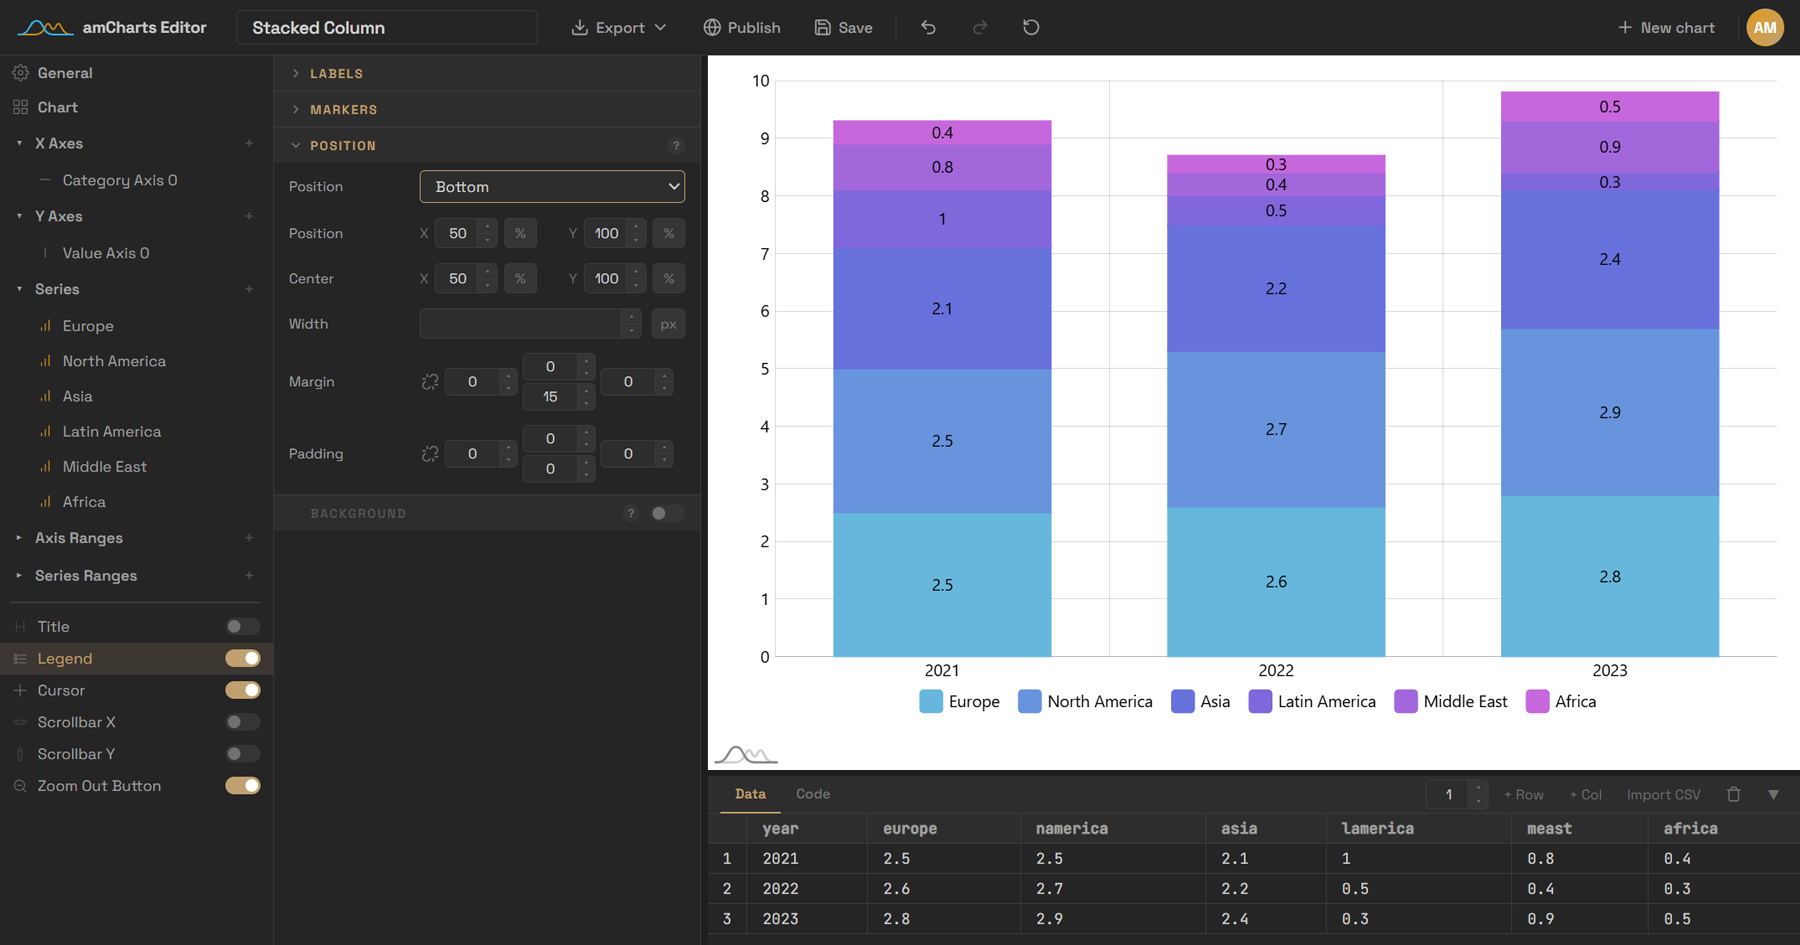
Build it visually in Chart Maker — pick from 60+ templates, drop in your data, style it point-and-click. Then export the config and carry on in code, or publish and embed it as is with Chart Maker Pro.
amCharts has always been powerful. Now AI eliminates the learning curve. Describe what you want — AI writes correct amCharts code.
Interactive tools and experiments from the DataViz Dojo — all powered by amCharts 5 Charts.
Custom chart design, complex dashboards, full-stack integration — from the team that wrote amCharts. Talk to our team