Anguilla SVG Map
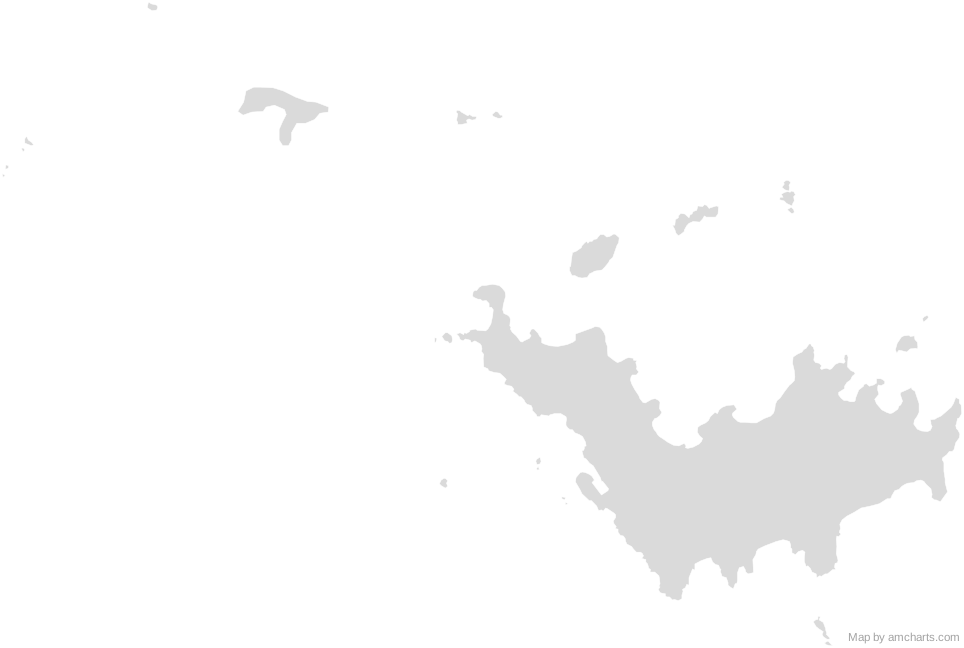
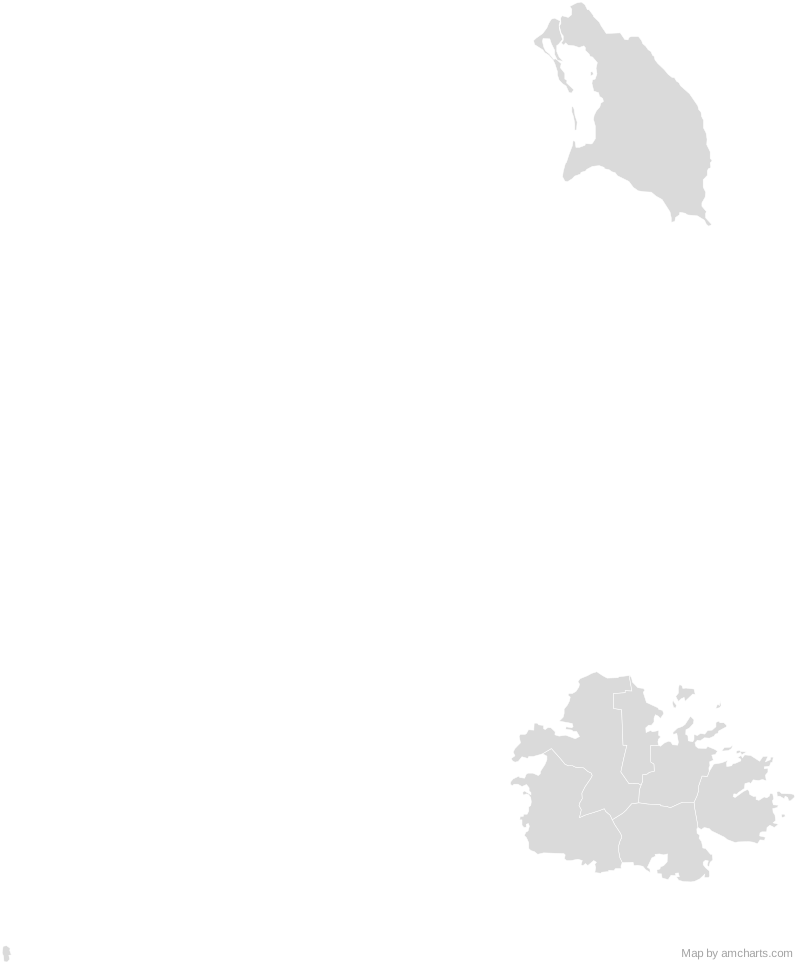
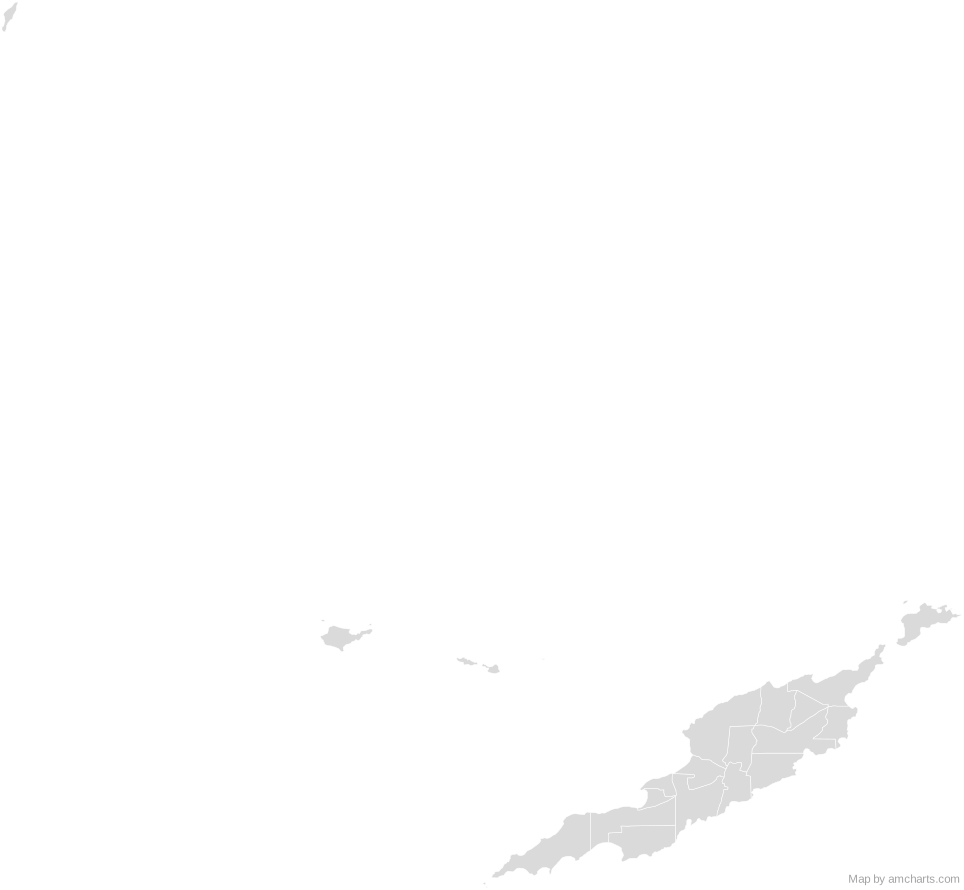
Free Anguilla SVG map with 20 areas, in Mercator projection, high and low detail.
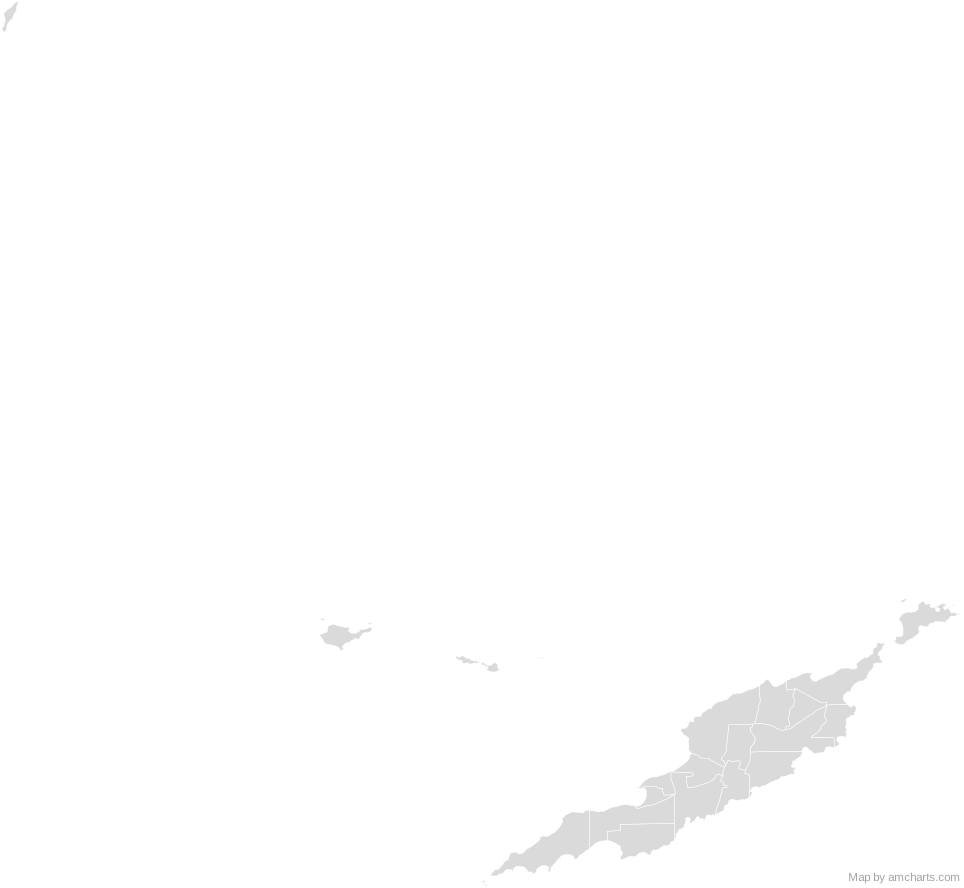
Free for any use, commercial projects included, as long as you keep the amCharts credit (CC BY 4.0).
All 427 maps, no credit needed: $99 Every SVG map in one ZIP, royalty-free, with updates.20 regions, named and coded.
- Blowing Point
AI-BP - Dog Island
AI-DGI - East End
AI-EE - George Hill
AI-GH - Island Harbour
AI-IH - North Hill
AI-NH - North Side
AI-NS - Prickly Pear East
AI-PPE - Prickly Pear West
AI-PPW - Sandy Ground
AI-SG - Sandy Hill
AI-SH - Scrub Island
AI-SCI - Seal Island
AI-SEI - Sombrero Island
AI-SOI - South Hill
AI-SO - Stoney Ground
AI-ST - The Farrington
AI-TF - The Quarter
AI-TQ - The Valley
AI-TV - West End
AI-WE
No region matches that.
Need it interactive in your app?
The same map ships with the amCharts 5 library as am5geodata_anguillaLow, ready for zoom, tooltips, heat maps and drill-downs. See JavaScript Maps.
import am5geodata from "@amcharts/amcharts5-geodata/anguillaLow";

chart.series.push(
  am5map.MapPolygonSeries.new(root, {
    geoJSON: am5geodata
  })
);
Can I use this map commercially?
Yes, for free, as long as you keep the amCharts credit (CC BY 4.0). To use maps without the credit, get the SVG Maps pack: all 427 maps for $99, one payment.
Which projection is it in?
Mercator, fitted to the map's own bounds. For Equal Earth, Albers, orthographic and others, use the SVG Map Generator.
How are the regions identified?
Each region is its own <path> with an id (the ISO code where one exists) and a data-name, so you can style or script it directly.
Will it open in Figma, Illustrator or Inkscape?
Yes. It is plain SVG: no scripts, fonts or external references.