Quebec Census Divisions SVG Map
Free Quebec Census Divisions SVG map with 98 census divisions, in Mercator projection, high and low detail.
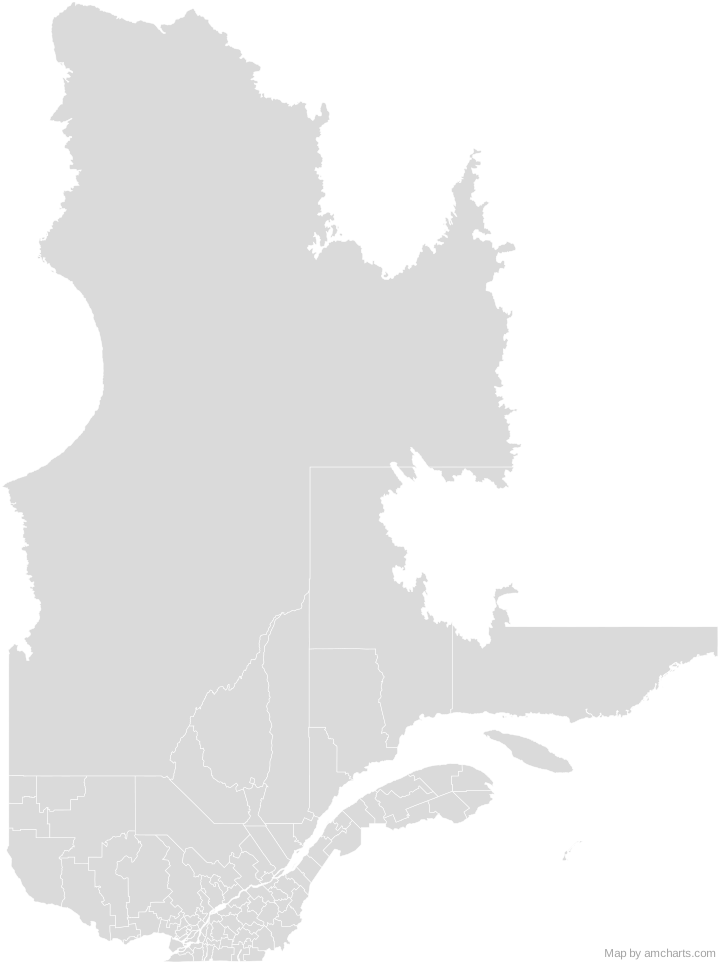
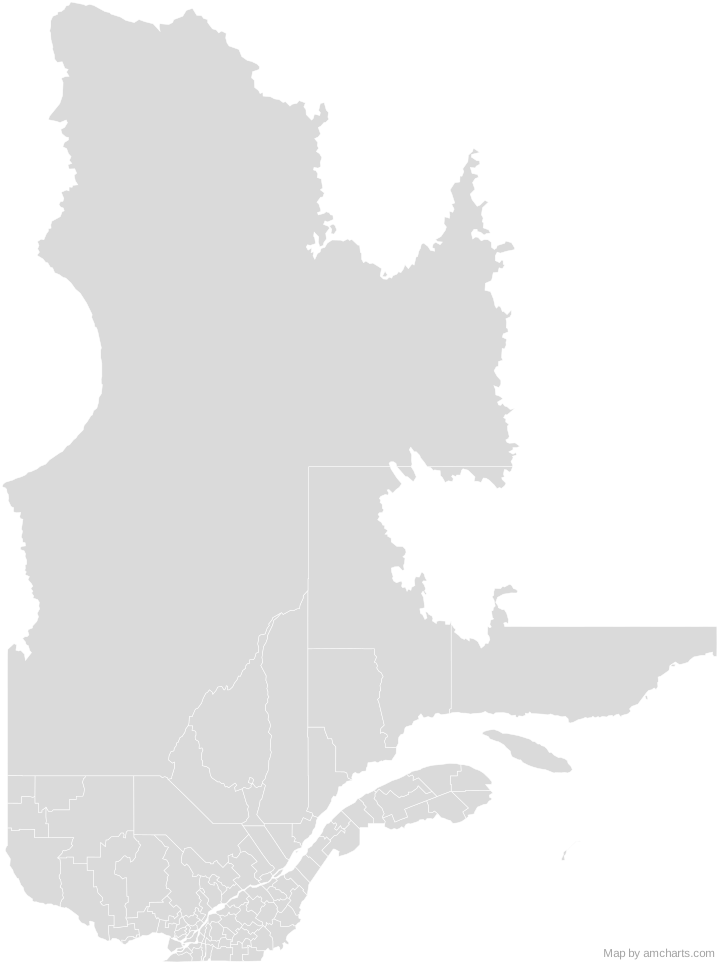
Free for any use, commercial projects included, as long as you keep the amCharts credit (CC BY 4.0).
All 427 maps, no credit needed: $99 Every SVG map in one ZIP, royalty-free, with updates.98 regions, named and coded.
- Abitibi
2488 - Abitibi-Ouest
2487 - Acton
2448 - Antoine-Labelle
2479 - Argenteuil
2476 - Arthabaska
2439 - Avignon
2406 - Beauce-Sartigan
2429 - Beauharnois-Salaberry
2470 - Bécancour
2438 - Bellechasse
2419 - Bonaventure
2405 - Brome-Missisquoi
2446 - Charlevoix
2416 - Charlevoix-Est
2415 - Coaticook
2444 - D'Autray
2452 - Deux-Montagnes
2472 - Drummond
2449 - Francheville
2437 - Gatineau
2481 - Joliette
2461 - Kamouraska
2414 - L'Assomption
2460 - L'Érable
2432 - L'Île-d'Orléans
2420 - L'Islet
2417 - La Côte-de-Beaupré
2421 - La Côte-de-Gaspé
2403 - La Haute-Côte-Nord
2495 - La Haute-Gaspésie
2404 - La Haute-Yamaska
2447 - La Jacques-Cartier
2422 - La Matapédia
2407 - La Mitis
2409 - La Nouvelle-Beauce
2426 - La Rivière-du-Nord
2475 - La Tuque
2490 - La Vallée-de-l'Or
2489 - La Vallée-de-la-Gatineau
2483 - La Vallée-du-Richelieu
2457 - Lac-Saint-Jean-Est
2493 - Laval
2465 - Le Domaine-du-Roy
2491 - Le Granit
2430 - Le Haut-Richelieu
2456 - Le Haut-Saint-François
2441 - Le Haut-Saint-Laurent
2469 - Le Rocher-Percé
2402 - Le Saguenay-et-son-Fjord
2494 - Le Val-Saint-Franç
2442 - Les Appalaches
2431 - Les Basques
2411 - Les Collines-de-l'Outaouais
2482 - Les Etchemins
2428 - Les Îles-de-la-Madeleine
2401 - Les Jardins-de-Napierville
2468 - Les Laurentides
2478 - Les Maskoutains
2454 - Les Moulins
2464 - Les Pays-d'en-Haut
2477 - Les Sources
2440 - Lévis
2425 - Longueuil
2458 - Lotbinière
2433 - Manicouagan
2496 - Marguerite-D'Youville
2459 - Maria-Chapdelaine
2492 - Maskinongé
2451 - Matane
2408 - Matawinie
2462 - Mékinac
2435 - Memphrémagog
2445 - Minganie--Le Golfe-du-Saint-Laurent
2498 - Mirabel
2474 - Montcalm
2463 - Montmagny
2418 - Montréal
2466 - Nicolet-Yamaska
2450 - Nord-du-Québec
2499 - Papineau
2480 - Pierre-De Saurel
2453 - Pontiac
2484 - Portneuf
2434 - Québec
2423 - Rimouski-Neigette
2410 - Rivière-du-Loup
2412 - Robert-Cliche
2427 - Roussillon
2467 - Rouville
2455 - Rouyn-Noranda
2486 - Sept-Rivières--Caniapiscau
2497 - Shawinigan
2436 - Sherbrooke
2443 - Témiscamingue
2485 - Témiscouata
2413 - Thérèse-De Blainville
2473 - Vaudreuil-Soulanges
2471
No region matches that.
Need it interactive in your app?
The same map ships with the amCharts 5 library as am5geodata_region_canada_qcLow, ready for zoom, tooltips, heat maps and drill-downs. See JavaScript Maps.
import am5geodata from "@amcharts/amcharts5-geodata/region/canada/qcLow";

chart.series.push(
  am5map.MapPolygonSeries.new(root, {
    geoJSON: am5geodata
  })
);Around Quebec Census Divisions
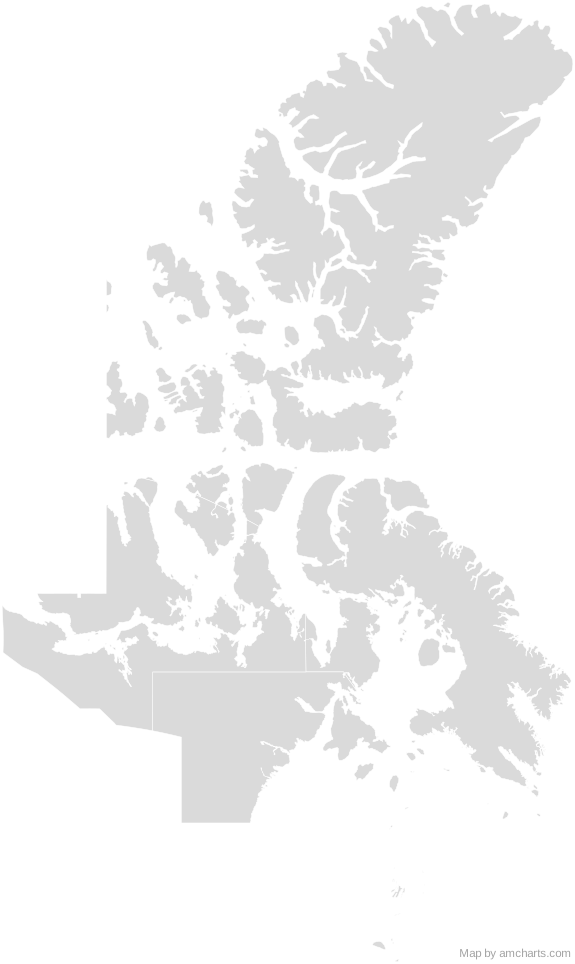 Nunavut Census DivisionsCanada Census Divisions
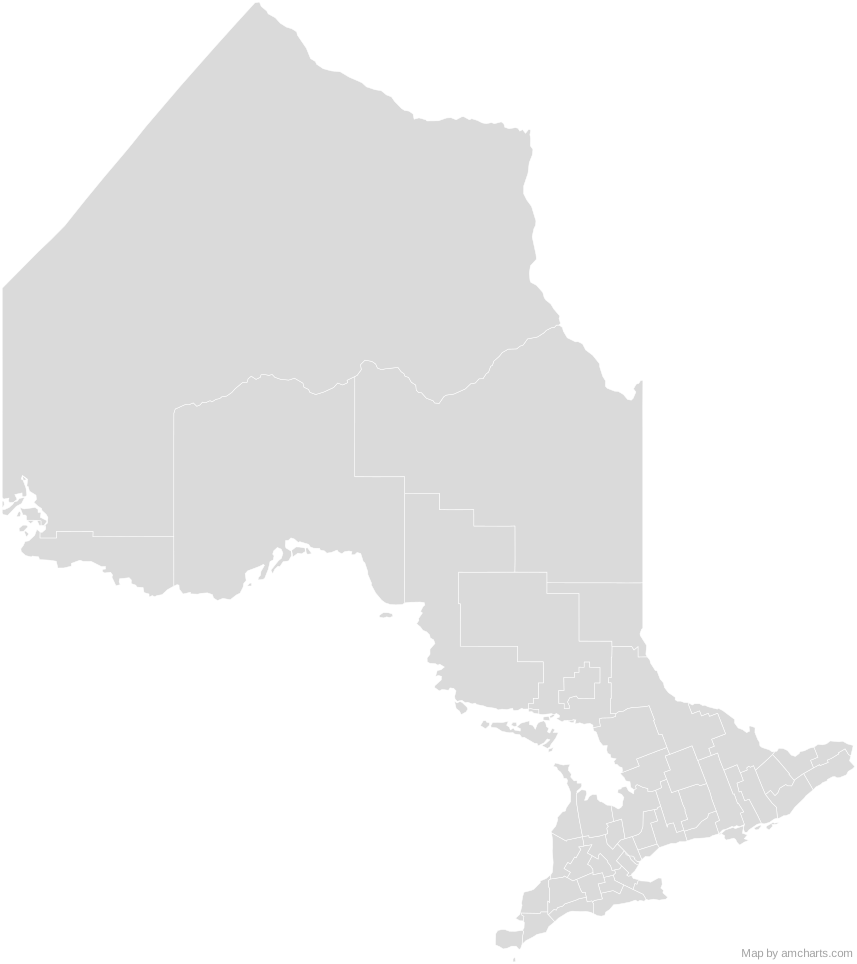 Ontario Census DivisionsCanada Census Divisions
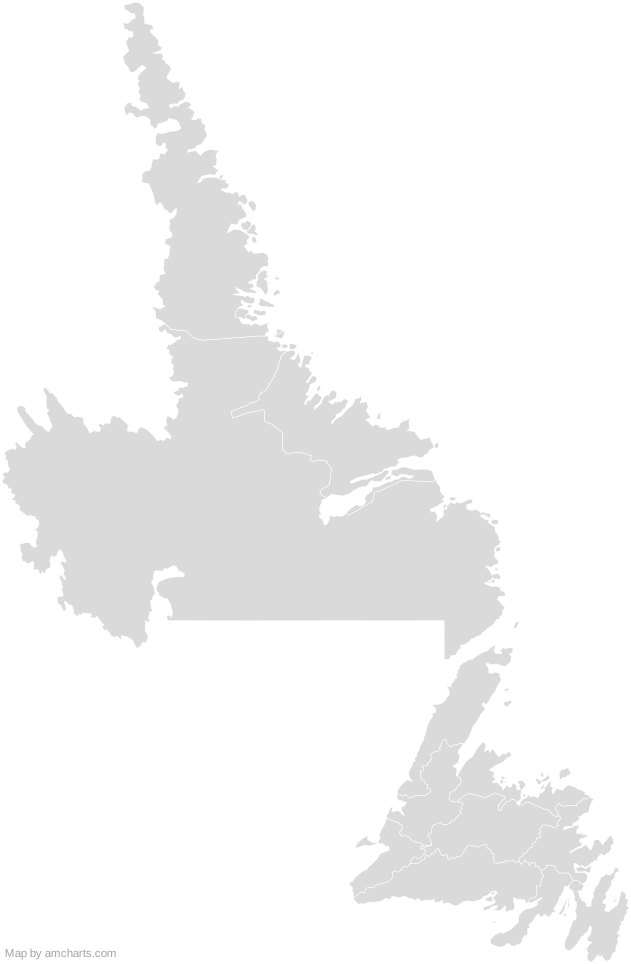 Newfoundland and Labrador Census DivisionsCanada Census Divisions
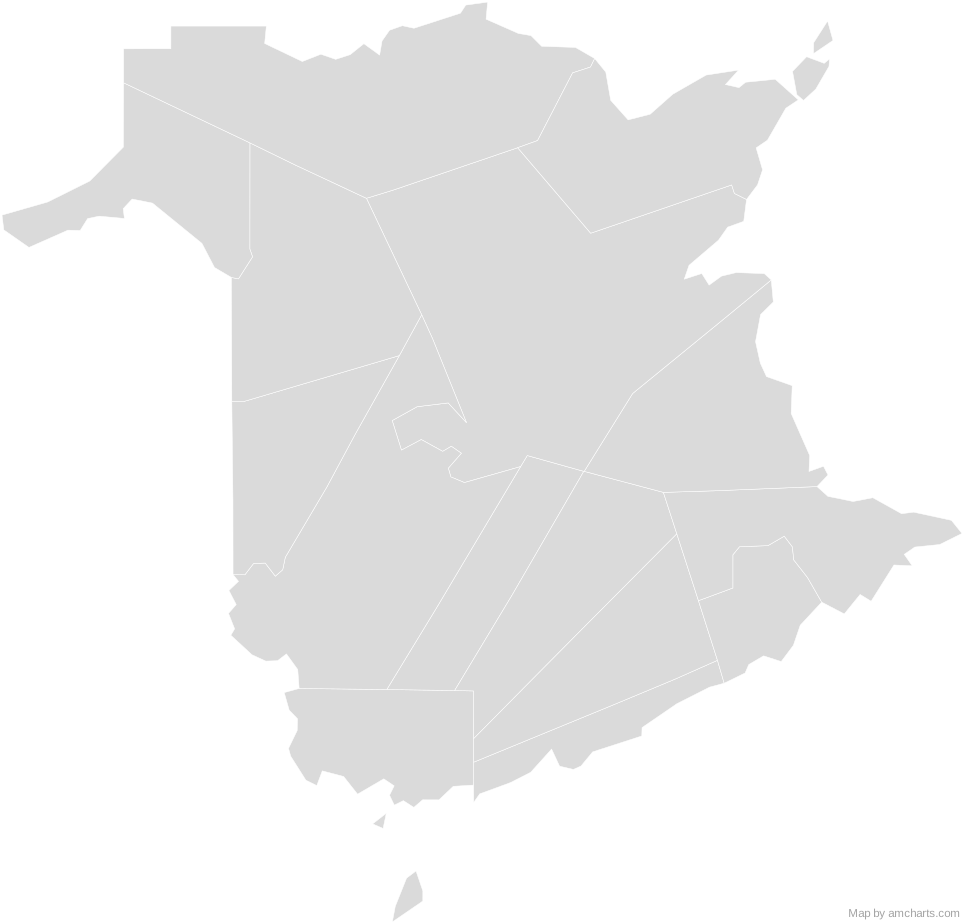 New Brunswick Census DivisionsCanada Census Divisions
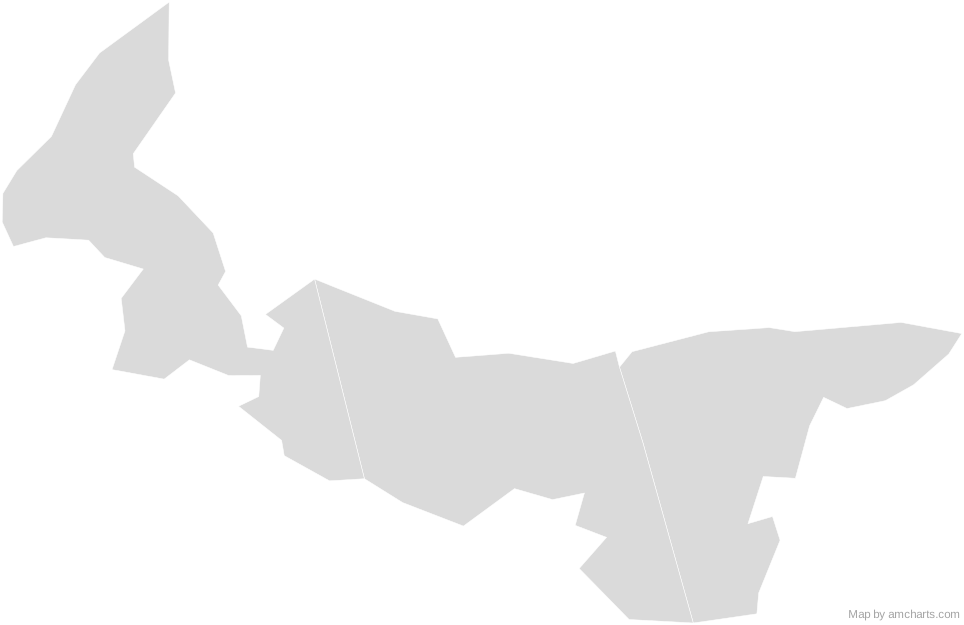 Prince Edward Island Census DivisionsCanada Census Divisions
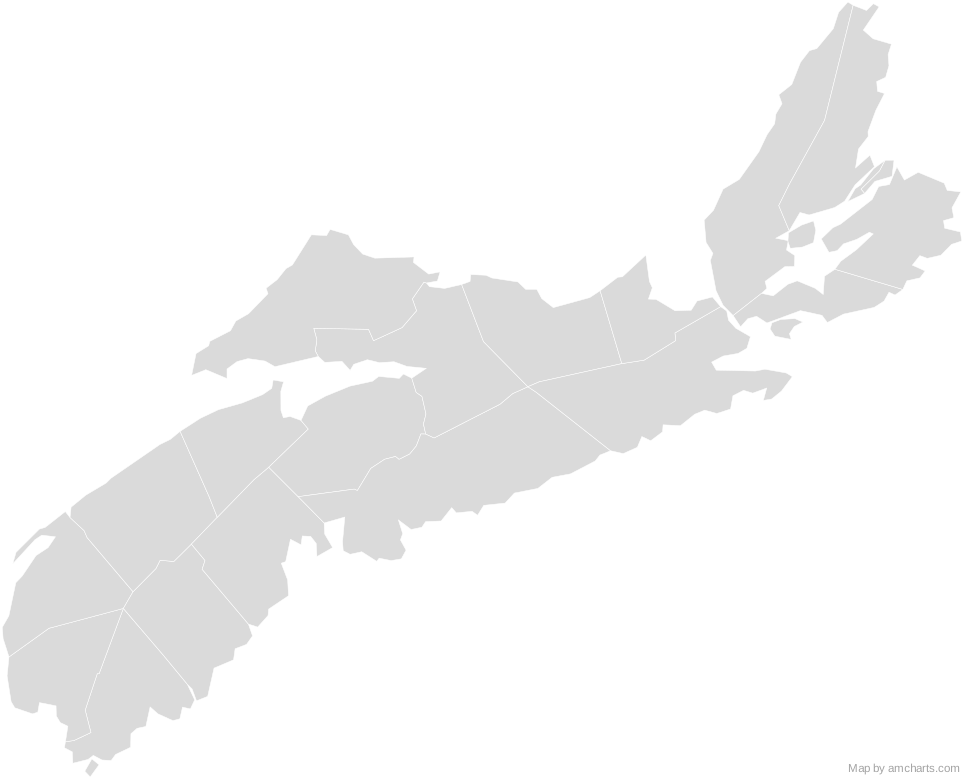 Nova Scotia Census DivisionsCanada Census Divisions
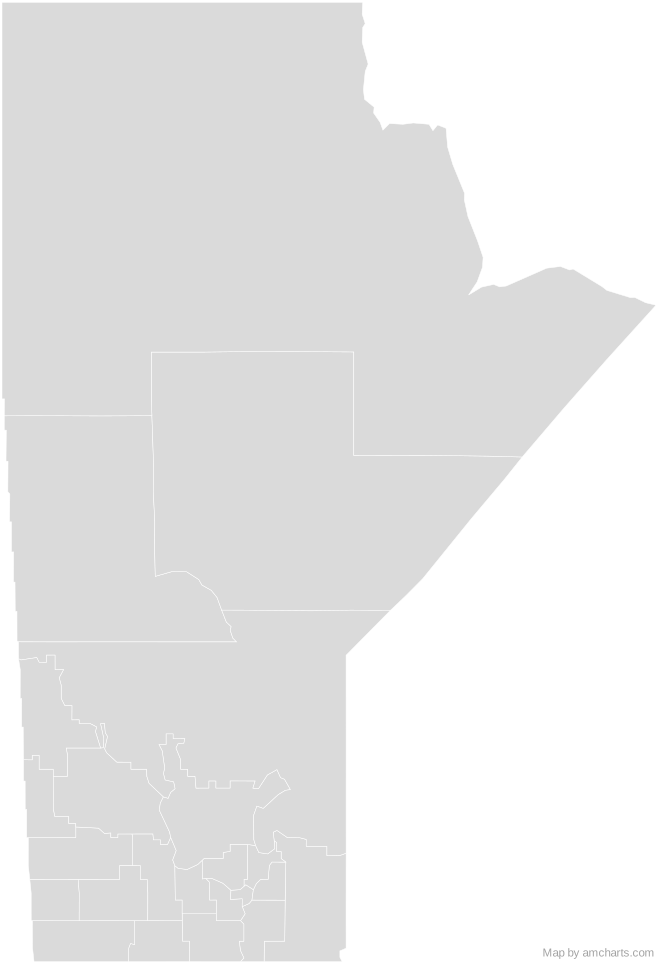 Manitoba Census DivisionsCanada Census Divisions
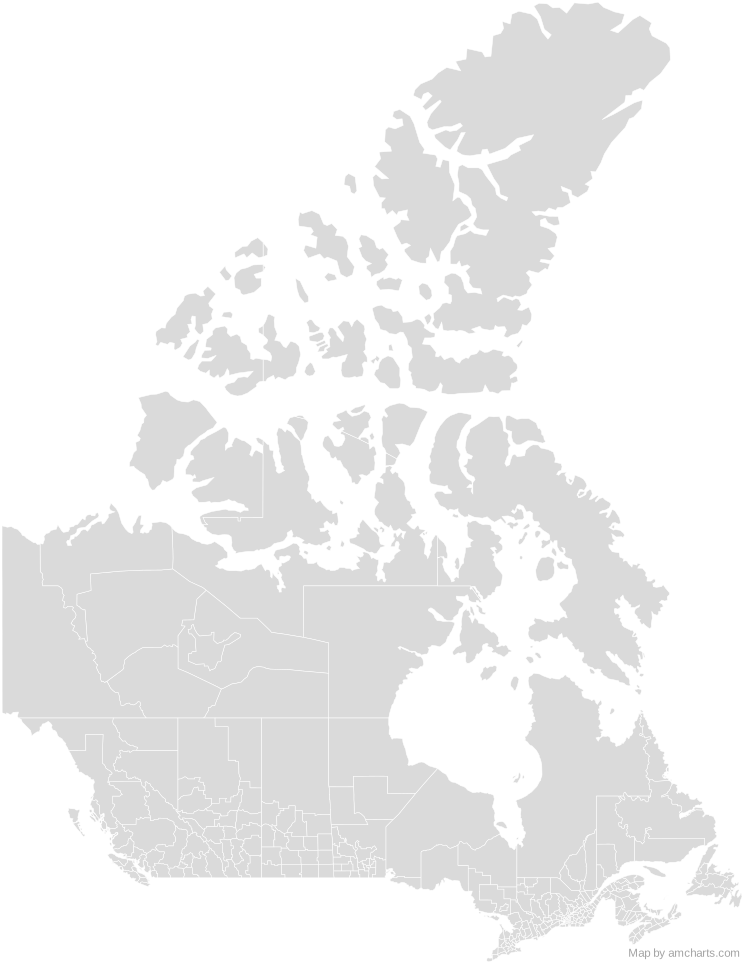 Canada Census Divisions
Can I use this map commercially?
Yes, for free, as long as you keep the amCharts credit (CC BY 4.0). To use maps without the credit, get the SVG Maps pack: all 427 maps for $99, one payment.
Which projection is it in?
Mercator, fitted to the map's own bounds. For Equal Earth, Albers, orthographic and others, use the SVG Map Generator.
How are the regions identified?
Each region is its own <path> with an id (the ISO code where one exists) and a data-name, so you can style or script it directly.
Will it open in Figma, Illustrator or Inkscape?
Yes. It is plain SVG: no scripts, fonts or external references.