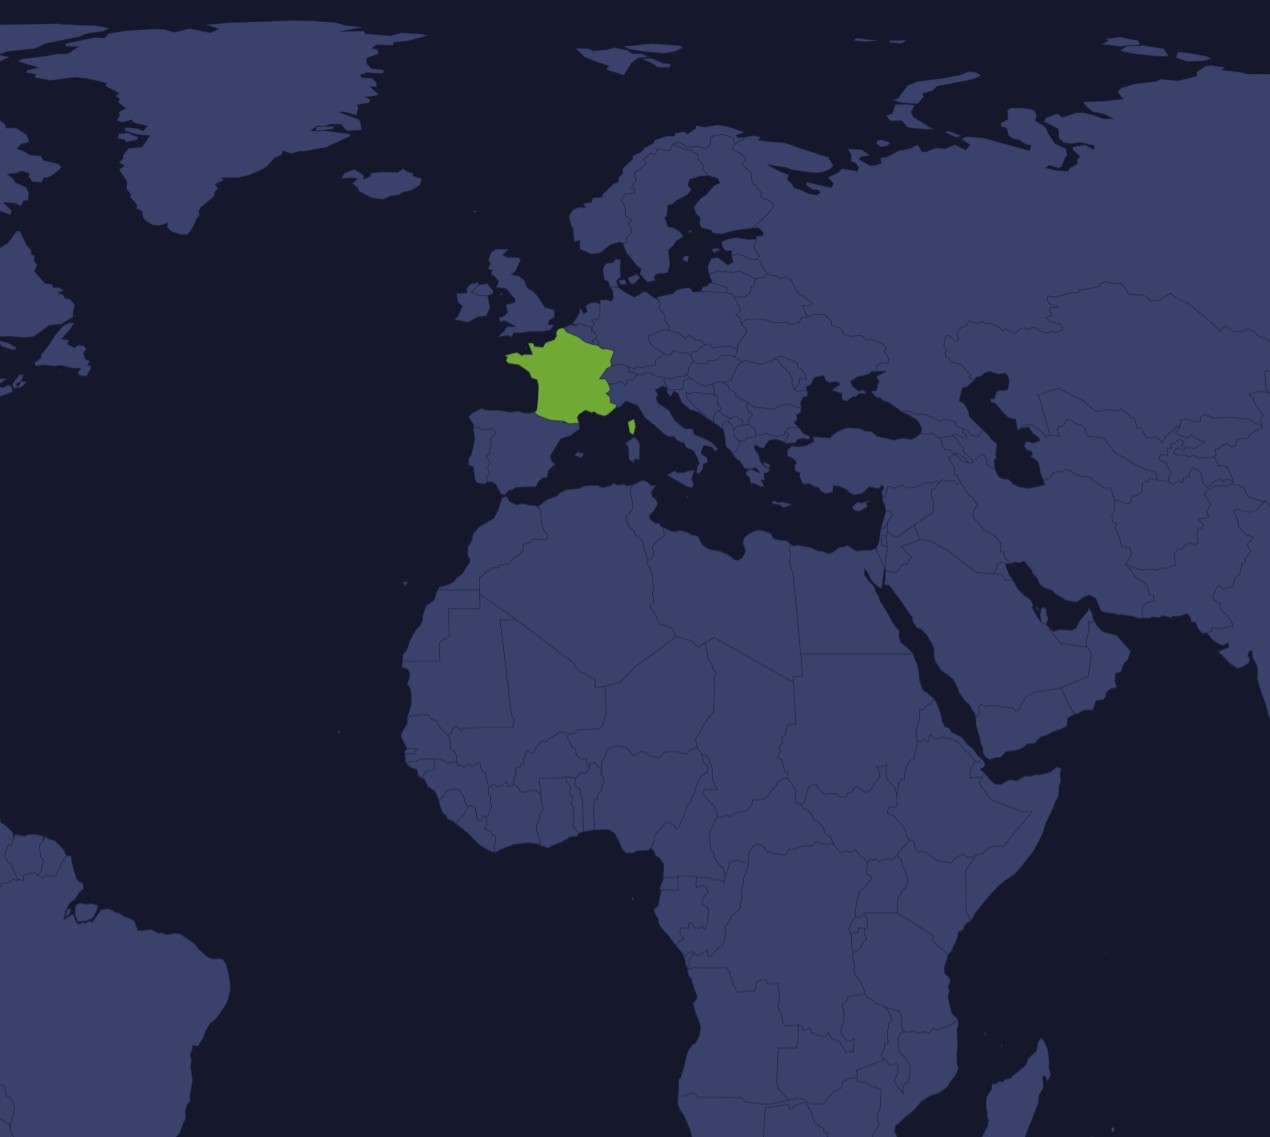
One world map, three projections: every 4 seconds it morphs from Equal Earth to Equirectangular to a globe and back, until you pick one with the Projection buttons. Drag the map to spin the world.
Every flat map stretches the round Earth somewhere. Mercator keeps local shapes but blows up the far north and south, Equal Earth keeps areas true, Natural Earth is a pleasing compromise, and a globe shows only one side at a time. For data colored by country, pick a projection that keeps areas fair.
Built with amCharts 5, a JavaScript library. The code includes your theme and renderer (canvas or SVG), but not the changes you make with the controls.
npm install @amcharts/amcharts5 and @amcharts/amcharts5-geodata. See Getting started.
The same chart as a JSON config. Chart Maker reads and writes this format, the library's JSON parser turns it into a chart, and the <am5-chart> element puts it on a page with no code."type" is the class to create and "settings" what you would pass to its new() in code; "properties" fill in its parts, lists such as series and axes or templates such as columns.template; "refs" holds objects used in more than one place ("#series-0" stands for the one named series-0); a string starting with "@" takes a value from another object, such as "@series.get('fill')".
A complete page. Save it as an .html file and open it in a browser.
Paste this into an AI coding assistant to build the chart from scratch. More in amCharts & AI.
// Create root element
// https://www.amcharts.com/docs/v5/getting-started/#Root_element
var root = am5.Root.new("chartdiv");

// Set themes
// https://www.amcharts.com/docs/v5/concepts/themes/
root.setThemes([
  am5themes_Animated.new(root),
  am5themes_Responsive.new(root)
]);

// Create the map chart
// https://www.amcharts.com/docs/v5/charts/map-chart/
var chart = root.container.children.push(
  am5map.MapChart.new(root, {
    minZoomLevel: 0.5, // zoom out to half the fitted size at most
    // go to the home view once the map is fitted
    autoHome: true,
    panX: "rotateX",    // dragging sideways turns the world...
    panY: "translateY", // ...and dragging up and down moves the map
    // hold Shift and drag a box to zoom into it
    boxZoom: "shift",
    projection: am5map.geoEqualEarth() // starts as Equal Earth
  })
);

// Zoom control
// https://www.amcharts.com/docs/v5/charts/map-chart/map-pan-zoom/#Zoom_control
var zoomControl = chart.set("zoomControl", am5map.ZoomControl.new(root, {}));

// the home button is hidden by default
zoomControl.homeButton.set("visible", true);

// Create polygon series for countries
// https://www.amcharts.com/docs/v5/charts/map-chart/map-polygon-series/
var polygonSeries = chart.series.push(
  am5map.MapPolygonSeries.new(root, {
    geoJSON: am5geodata_worldLow // low-detail world countries
  })
);

// Create graticule series (the grid), drawn under the countries
// https://www.amcharts.com/docs/v5/charts/map-chart/graticule-series/
var graticuleSeries = chart.series.insertIndex(
  0, am5map.GraticuleSeries.new(root, {})
);

graticuleSeries.mapLines.template.setAll({
  stroke: root.interfaceColors.get("alternativeBackground"), // a color that contrasts with the background...
  strokeOpacity: 0.1 // ...faint
});

// Create series for the ocean, drawn under everything
// https://www.amcharts.com/docs/v5/charts/map-chart/map-polygon-series/#Background_polygon
var backgroundSeries = chart.series.unshift(
  am5map.MapPolygonSeries.new(root, {})
);

// a faint tint of the land color, so the ocean shows in light and dark themes
backgroundSeries.mapPolygons.template.setAll({
  fill: root.interfaceColors.get("primaryButton"),
  fillOpacity: 0.1,
  strokeOpacity: 0 // no outline
});

backgroundSeries.data.push({
  geometry: am5map.getGeoRectangle(90, 180, -90, -180) // a rectangle around the whole world
});

// The projections to switch between, each with its raw function from d3-geo: the
// animation from one projection to another needs both. Mercator is left out, as it can not be animated
var projections = {
  globe: [am5map.geoOrthographic, d3.geoOrthographicRaw],
  equalEarth: [am5map.geoEqualEarth, d3.geoEqualEarthRaw],
  equirectangular: [am5map.geoEquirectangular, d3.geoEquirectangularRaw]
};
var current = "equalEarth"; // the projection on show

// Morph the map into another projection over a second
function morphTo(name) {
  if (name === current) {
    return;
  }
  var to = projections[name];
  var easing = am5.ease.inOut(am5.ease.cubic); // slow at the start and the end
  // new projection and its raw function, 1 second, and the raw one to start from
  chart.animateProjection(to[0](), to[1], 1000, easing, projections[current][1]);
  current = name;
  // dragging up and down tilts the globe and moves a flat map, which levels out again
  chart.set("panY", name === "globe" ? "rotateY" : "translateY");
  if (name !== "globe") {
    // level a tilted globe out again
    chart.animate({ key: "rotationY", to: 0, duration: 1000, easing: easing });
  }
}

// Every 4 seconds the map morphs into the next projection, until the chart is gone
var order = ["equalEarth", "equirectangular", "globe"]; // the projections in turn
var cycle = setInterval(function() {
  if (chart.isDisposed()) {
    clearInterval(cycle);
    return;
  }
  morphTo(order[(order.indexOf(current) + 1) % order.length]);
}, 4000);