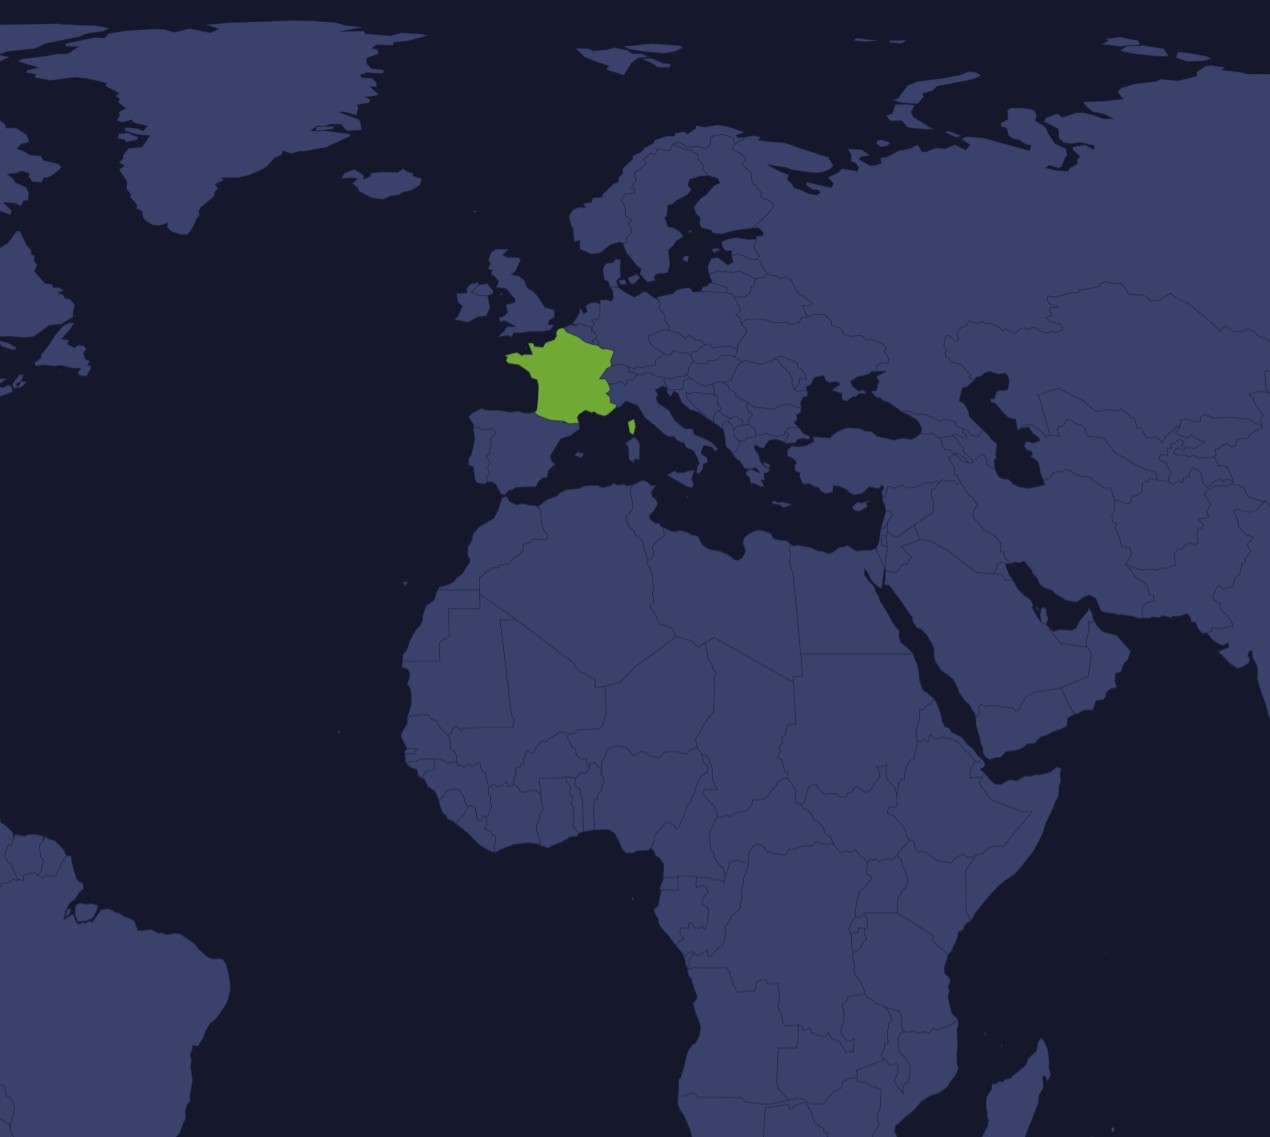
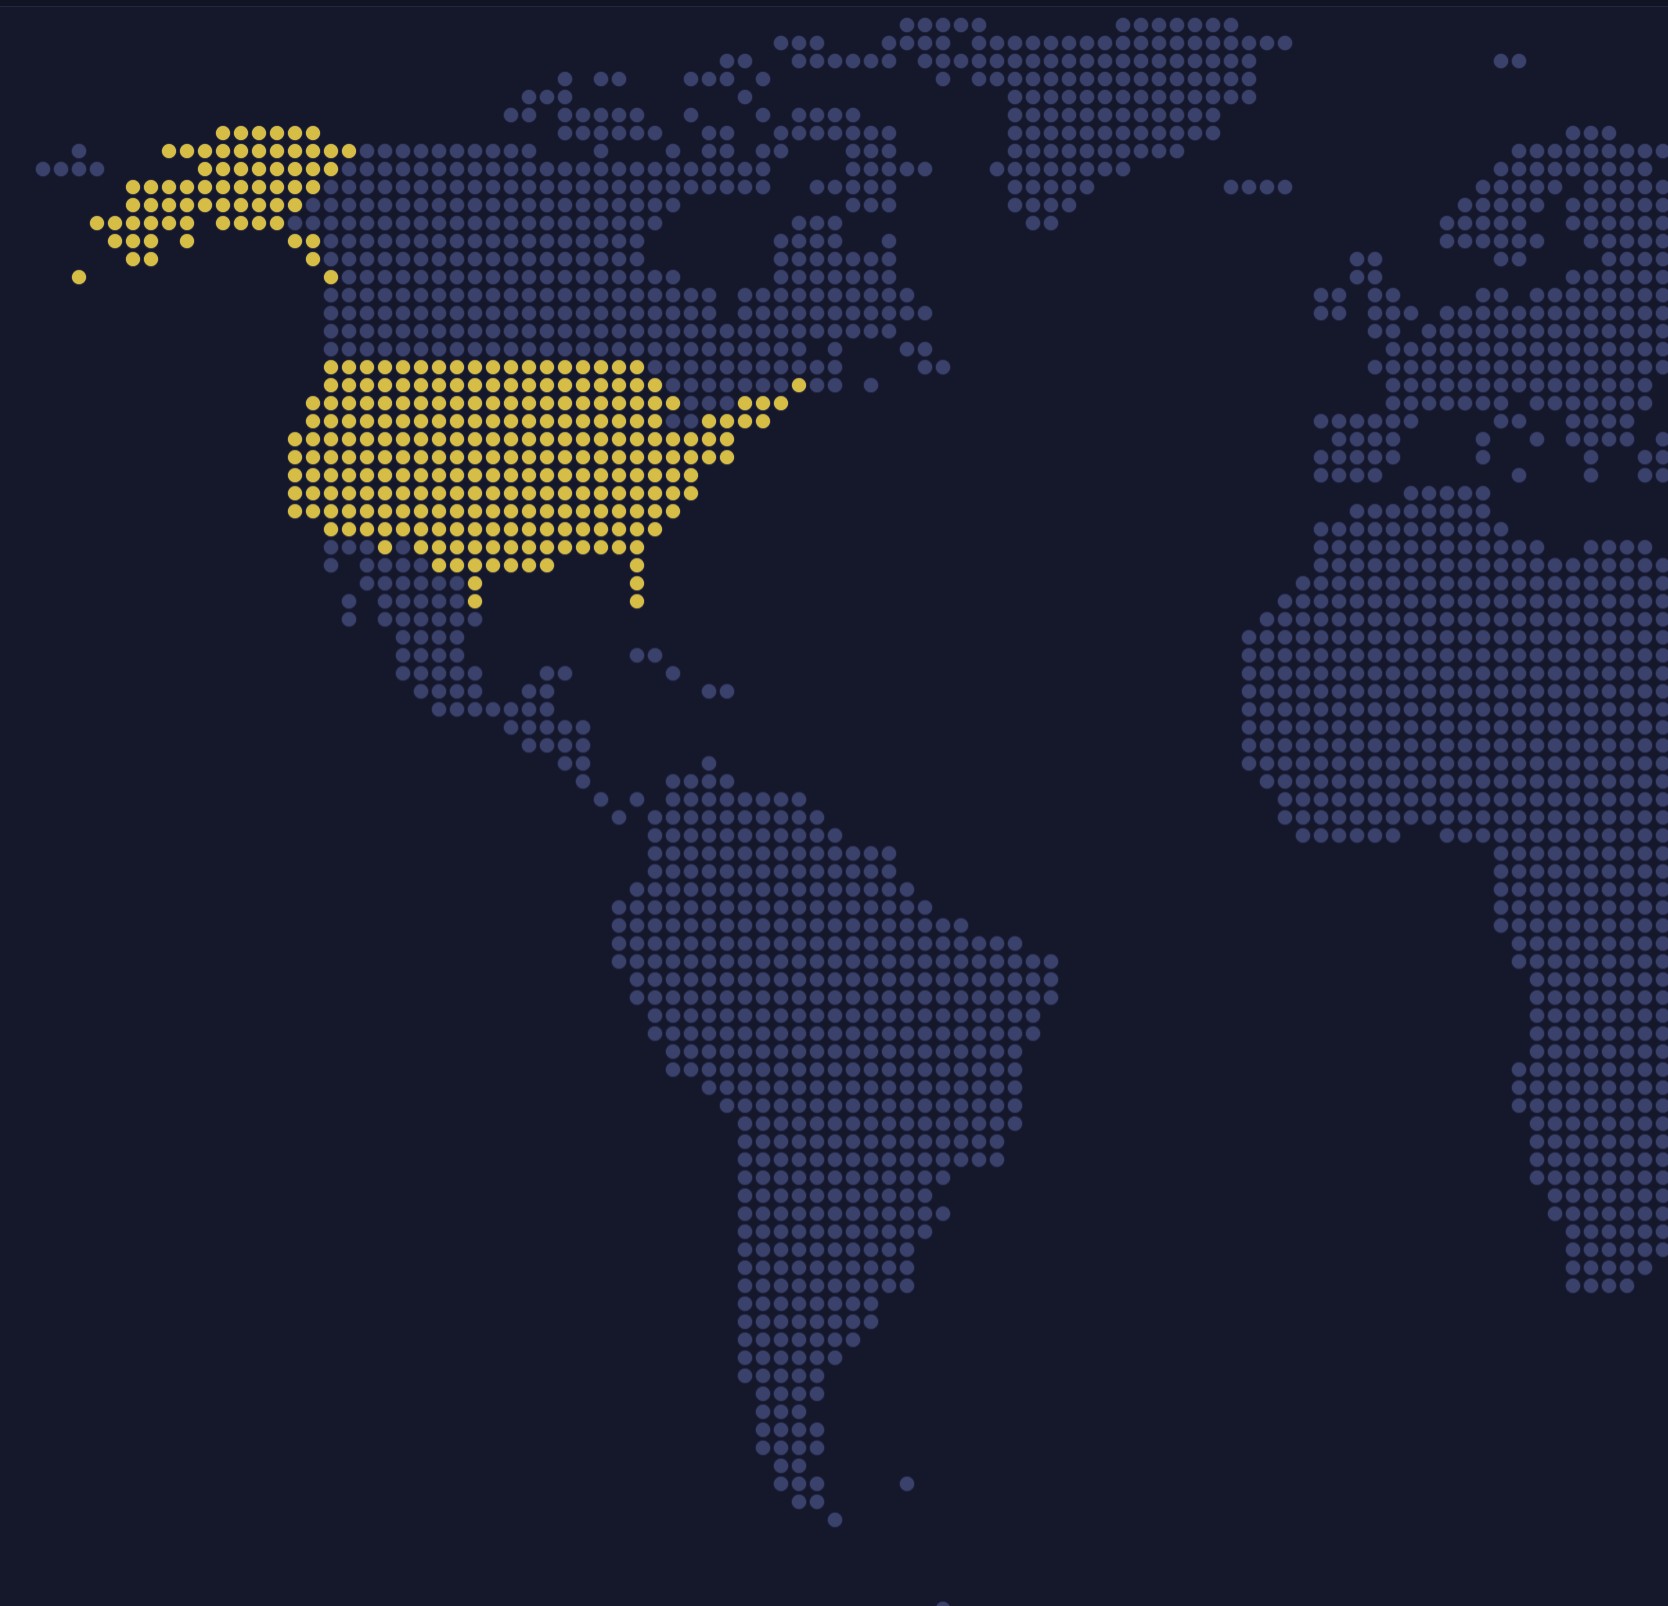
One world map, 104 projections. The Projection list holds the projections of the d3-geo-projection library: pick one, or step through them with the arrows.
Every flat map distorts the globe, and the projection decides how. Equal-area ones like Mollweide keep sizes true, Mercator keeps shapes, and compromises like Robinson or Winkel Tripel balance the two. A map chart takes any d3 projection, so stepping through this list is a quick way to find the one your data needs.
Built with amCharts 5, a JavaScript library. The code includes your theme and renderer (canvas or SVG), but not the changes you make with the controls.
npm install @amcharts/amcharts5 and @amcharts/amcharts5-geodata. See Getting started.
The same chart as a JSON config. Chart Maker reads and writes this format, the library's JSON parser turns it into a chart, and the <am5-chart> element puts it on a page with no code."type" is the class to create and "settings" what you would pass to its new() in code; "properties" fill in its parts, lists such as series and axes or templates such as columns.template; "refs" holds objects used in more than one place ("#series-0" stands for the one named series-0); a string starting with "@" takes a value from another object, such as "@series.get('fill')".
A complete page. Save it as an .html file and open it in a browser.
Paste this into an AI coding assistant to build the chart from scratch. More in amCharts & AI.
// Create root element
// https://www.amcharts.com/docs/v5/getting-started/#Root_element
var root = am5.Root.new("chartdiv");

// Set themes
// https://www.amcharts.com/docs/v5/concepts/themes/
root.setThemes([
  am5themes_Animated.new(root),
  am5themes_Responsive.new(root)
]);

// Colors from the theme, so the map follows the theme
var colors = am5.ColorSet.new(root, {});

// Create the map chart
// https://www.amcharts.com/docs/v5/charts/map-chart/
var chart = root.container.children.push(am5map.MapChart.new(root, {
  minZoomLevel: 0.5, // can zoom out to half the fitted size
  // go to the home view once the map is fitted
  autoHome: true,
  panX: "rotateX", // dragging sideways turns the globe...
  panY: "none",    // ...but not up and down
  // the first projection of the list; the others come from d3-geo-projection
  projection: d3.geoAiry()
}));

// Add zoom control
// https://www.amcharts.com/docs/v5/charts/map-chart/map-pan-zoom/#Zoom_control
var zoomControl = chart.set("zoomControl", am5map.ZoomControl.new(root, {})); // + and - zoom buttons

// the home button is hidden by default
zoomControl.homeButton.set("visible", true);

// Create series for the ocean: a rectangle around the whole world shows the
// outline of each projection
// https://www.amcharts.com/docs/v5/charts/map-chart/map-polygon-series/#Background_polygon
var backgroundSeries = chart.series.push(am5map.MapPolygonSeries.new(root, {}));

backgroundSeries.mapPolygons.template.setAll({
  fill: colors.getIndex(0), // the theme's first color...
  fillOpacity: 0.12,        // ...as a light tint
  strokeOpacity: 0          // no outline
});

backgroundSeries.data.push({
  geometry: am5map.getGeoRectangle(90, 180, -90, -180)
});

// Create graticule series
// https://www.amcharts.com/docs/v5/charts/map-chart/graticule-series/
var graticuleSeries = chart.series.push(am5map.GraticuleSeries.new(root, {})); // lines every 10 degrees

graticuleSeries.mapLines.template.setAll({
  stroke: root.interfaceColors.get("alternativeBackground"), // contrasting with the background...
  strokeOpacity: 0.1 // ...and faint
});

// Create main polygon series for countries
// https://www.amcharts.com/docs/v5/charts/map-chart/map-polygon-series/
var polygonSeries = chart.series.push(am5map.MapPolygonSeries.new(root, {
  geoJSON: am5geodata_worldLow // the world's countries, in low detail
}));