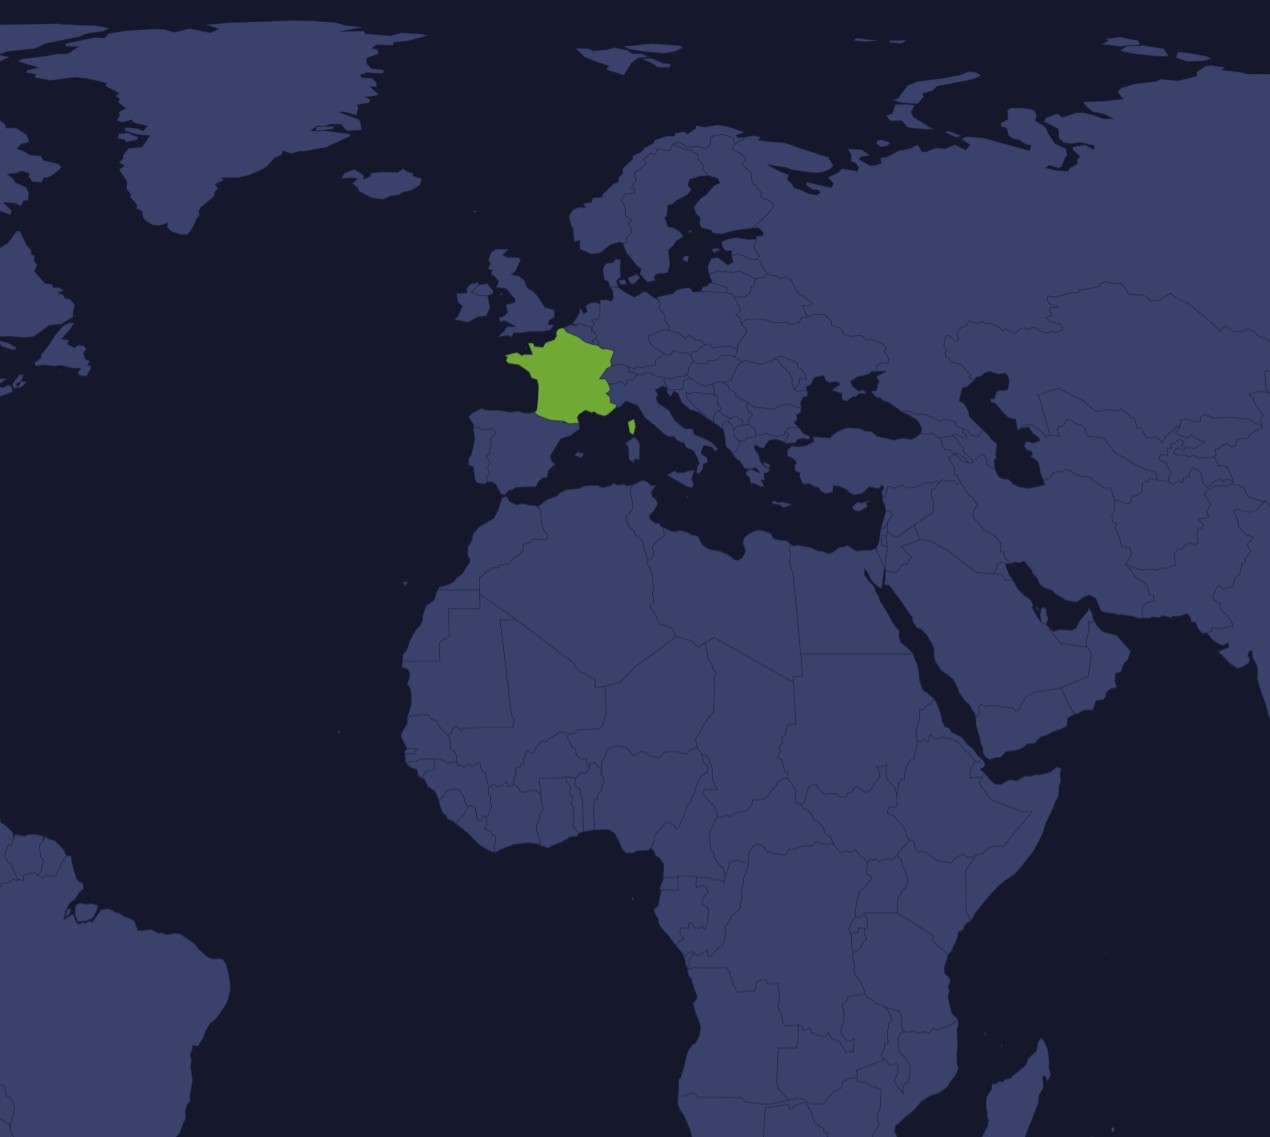
A map with a year slider: drag it, or press play, and countries light up as the slider passes the year they joined a treaty. The treaty is fictional.
A slider adds time to a map without crowding it: each position shows the state of things in one year, and playing it shows how something spread. It suits steady growth, like countries joining a treaty, better than values that go up and down, which a line chart follows more easily.
Built with amCharts 5, a JavaScript library. The code includes your theme and renderer (canvas or SVG), but not the changes you make with the controls.
npm install @amcharts/amcharts5 and @amcharts/amcharts5-geodata. See Getting started.
The same chart as a JSON config. Chart Maker reads and writes this format, the library's JSON parser turns it into a chart, and the <am5-chart> element puts it on a page with no code."type" is the class to create and "settings" what you would pass to its new() in code; "properties" fill in its parts, lists such as series and axes or templates such as columns.template; "refs" holds objects used in more than one place ("#series-0" stands for the one named series-0); a string starting with "@" takes a value from another object, such as "@series.get('fill')".
A complete page. Save it as an .html file and open it in a browser.
Paste this into an AI coding assistant to build the chart from scratch. More in amCharts & AI.
// The year each country joined a fictional treaty
var data = [
	{ year: 2008, country: "AF" },
	{ year: 2005, country: "AL" },
	{ year: 1993, country: "DZ" },
	{ year: 2019, country: "AD" },
	{ year: 2021, country: "AO" },
	{ year: 1993, country: "AG" },
	{ year: 1993, country: "AR" },
	{ year: 2001, country: "AM" },
	{ year: 1979, country: "AU" },
	{ year: 1965, country: "AT" },
	{ year: 2004, country: "AZ" },
	{ year: 2010, country: "BS" },
	{ year: 1992, country: "BH" },
	{ year: 1996, country: "BD" },
	{ year: 1997, country: "BB" },
	{ year: 1964, country: "BY" },
	{ year: 1979, country: "BE" },
	{ year: 2025, country: "BZ" },
	{ year: 1978, country: "BJ" },
	{ year: 2018, country: "BT" },
	{ year: 1999, country: "BO" },
	{ year: 1997, country: "BA" },
	{ year: 1975, country: "BW" },
	{ year: 2006, country: "BR" },
	{ year: 2000, country: "BN" },
	{ year: 1965, country: "BG" },
	{ year: 1991, country: "BF" },
	{ year: 2018, country: "BI" },
	{ year: 2022, country: "CV" },
	{ year: 1964, country: "KH" },
	{ year: 1992, country: "CM" },
	{ year: 1990, country: "CA" },
	{ year: 1966, country: "CF" },
	{ year: 1979, country: "CL" },
	{ year: 1991, country: "CN" },
	{ year: 1983, country: "CO" },
	{ year: 2019, country: "KM" },
	{ year: 2013, country: "CK" },
	{ year: 1991, country: "CR" },
	{ year: 1995, country: "CI" },
	{ year: 1997, country: "HR" },
	{ year: 1978, country: "CU" },
	{ year: 1984, country: "CY" },
	{ year: 1997, country: "CZ" },
	{ year: 2018, country: "CD" },
	{ year: 1976, country: "DK" },
	{ year: 1987, country: "DJ" },
	{ year: 1992, country: "DM" },
	{ year: 2006, country: "DO" },
	{ year: 1966, country: "EC" },
	{ year: 1963, country: "EG" },
	{ year: 2002, country: "SV" },
	{ year: 1997, country: "EE" },
	{ year: 2024, country: "ET" },
	{ year: 2014, country: "FJ" },
	{ year: 1966, country: "FI" },
	{ year: 1963, country: "FR" },
	{ year: 2010, country: "GA" },
	{ year: 1998, country: "GE" },
	{ year: 1979, country: "DE" },
	{ year: 1972, country: "GH" },
	{ year: 1966, country: "GR" },
	{ year: 1988, country: "GT" },
	{ year: 1995, country: "GN" },
	{ year: 2018, country: "GY" },
	{ year: 1987, country: "HT" },
	{ year: 1979, country: "VA" },
	{ year: 2004, country: "HN" },
	{ year: 1966, country: "HU" },
	{ year: 2006, country: "IS" },
	{ year: 1964, country: "IN" },
	{ year: 1985, country: "ID" },
	{ year: 2005, country: "IR" },
	{ year: 2025, country: "IQ" },
	{ year: 1985, country: "IE" },
	{ year: 1963, country: "IL" },
	{ year: 1973, country: "IT" },
	{ year: 2006, country: "JM" },
	{ year: 1965, country: "JP" },
	{ year: 1983, country: "JO" },
	{ year: 1999, country: "KZ" },
	{ year: 1993, country: "KE" },
	{ year: 1982, country: "KW" },
	{ year: 2000, country: "KG" },
	{ year: 2002, country: "LA" },
	{ year: 1996, country: "LV" },
	{ year: 2002, country: "LB" },
	{ year: 1993, country: "LS" },
	{ year: 2009, country: "LR" },
	{ year: 2015, country: "LI" },
	{ year: 1999, country: "LT" },
	{ year: 1987, country: "LU" },
	{ year: 1966, country: "MG" },
	{ year: 2025, country: "MW" },
	{ year: 1989, country: "MY" },
	{ year: 2023, country: "MV" },
	{ year: 1998, country: "ML" },
	{ year: 2004, country: "MT" },
	{ year: 2010, country: "MH" },
	{ year: 2001, country: "MR" },
	{ year: 2000, country: "MU" },
	{ year: 1975, country: "MX" },
	{ year: 1986, country: "MC" },
	{ year: 1998, country: "MN" },
	{ year: 2010, country: "ME" },
	{ year: 1963, country: "MA" },
	{ year: 2002, country: "MZ" },
	{ year: 2017, country: "MM" },
	{ year: 2002, country: "NP" },
	{ year: 1968, country: "NL" },
	{ year: 1987, country: "NZ" },
	{ year: 2007, country: "NI" },
	{ year: 1968, country: "NE" },
	{ year: 1974, country: "NG" },
	{ year: 1998, country: "MK" },
	{ year: 1965, country: "NO" },
	{ year: 2003, country: "OM" },
	{ year: 2009, country: "PK" },
	{ year: 2024, country: "PW" },
	{ year: 1988, country: "PA" },
	{ year: 2023, country: "PG" },
	{ year: 2001, country: "PY" },
	{ year: 1992, country: "PE" },
	{ year: 1971, country: "PH" },
	{ year: 1965, country: "PL" },
	{ year: 1998, country: "PT" },
	{ year: 2006, country: "QA" },
	{ year: 1977, country: "KR" },
	{ year: 2002, country: "MD" },
	{ year: 1965, country: "RO" },
	{ year: 1964, country: "RU" },
	{ year: 2012, country: "RW" },
	{ year: 1983, country: "SM" },
	{ year: 2016, country: "ST" },
	{ year: 1998, country: "SA" },
	{ year: 1998, country: "SN" },
	{ year: 2005, country: "RS" },
	{ year: 2024, country: "SC" },
	{ year: 2024, country: "SL" },
	{ year: 1990, country: "SG" },
	{ year: 1997, country: "SK" },
	{ year: 1996, country: "SI" },
	{ year: 1980, country: "ZA" },
	{ year: 1981, country: "ES" },
	{ year: 1966, country: "LK" },
	{ year: 2004, country: "VC" },
	{ year: 2019, country: "PS" },
	{ year: 2022, country: "SD" },
	{ year: 1976, country: "SE" },
	{ year: 1969, country: "CH" },
	{ year: 1963, country: "SY" },
	{ year: 2016, country: "TJ" },
	{ year: 1963, country: "TH" },
	{ year: 2024, country: "TO" },
	{ year: 1970, country: "TT" },
	{ year: 1971, country: "TN" },
	{ year: 1996, country: "TR" },
	{ year: 1996, country: "UG" },
	{ year: 1964, country: "UA" },
	{ year: 2010, country: "AE" },
	{ year: 1979, country: "GB" },
	{ year: 1968, country: "TZ" },
	{ year: 1974, country: "US" },
	{ year: 1987, country: "UY" },
	{ year: 2000, country: "UZ" },
	{ year: 1999, country: "VE" },
	{ year: 1999, country: "VN" },
	{ year: 2006, country: "ZM" },
	{ year: 1998, country: "ZW" }
];

// Create root element
// https://www.amcharts.com/docs/v5/getting-started/#Root_element
var root = am5.Root.new("chartdiv");

// Set themes
// https://www.amcharts.com/docs/v5/concepts/themes/
root.setThemes([
  am5themes_Animated.new(root),
  am5themes_Responsive.new(root)
]);

// Create the map chart
// https://www.amcharts.com/docs/v5/charts/map-chart/
var chart = root.container.children.push(am5map.MapChart.new(root, {
  // near-black space behind the satellite picture, shown only with it
  background: am5.Rectangle.new(root, {
    fill: am5.color(0x101318),
    fillOpacity: 0
  }),
  minZoomLevel: 0.5, // can zoom out to half the fitted size
  // go to the home view once the map is fitted
  autoHome: true,
  panX: "rotateX",                    // dragging sideways turns the globe...
  panY: "translateY",                 // ...and up and down moves the map
  projection: am5map.geoEqualEarth(), // a projection that keeps the countries' areas true
  // room for the title above the map and the slider below it
  paddingTop: 40,
  paddingBottom: 50
}));

// Add zoom control
// https://www.amcharts.com/docs/v5/charts/map-chart/map-pan-zoom/#Zoom_control
var zoomControl = chart.set("zoomControl", am5map.ZoomControl.new(root, {})); // + and - zoom buttons

// the home button is hidden by default
zoomControl.homeButton.set("visible", true);

// Title, in the room above the map ("absolute" places it from the chart's top edge, not inside the padding)
var title = chart.children.unshift(am5.Label.new(root, {
  text: "Countries that joined a fictional treaty",
  fontSize: 22,        // large...
  fontWeight: "400",   // ...regular-weight text...
  textAlign: "center", // ...with wrapped lines centered
  // wraps on a narrow screen instead of being cut off
  oversizedBehavior: "wrap",
  maxWidth: am5.percent(90), // at most 90% of the chart's width
  position: "absolute",
  x: am5.percent(50),        // in the middle...
  centerX: am5.percent(50)   // ...anchored by its center
}));

// Create series for the water: a faint fill behind the countries
// https://www.amcharts.com/docs/v5/charts/map-chart/map-polygon-series/#Background_polygon
var waterSeries = chart.series.push(am5map.MapPolygonSeries.new(root, {
  // the map fits the countries, not this rectangle around the whole world
  affectsBounds: false
}));

waterSeries.mapPolygons.template.setAll({
  fill: root.interfaceColors.get("alternativeBackground"), // the color that contrasts with the background...
  fillOpacity: 0.05, // ...barely there
  strokeOpacity: 0   // no outline
});

waterSeries.data.push({
  geometry: am5map.getGeoRectangle(90, 180, -90, -180) // a rectangle over the whole globe
});

// Satellite view: NASA's picture of the Earth by day, under the grid lines and the countries. Hidden at first
// (visible: false): make it visible for the satellite view
// https://www.amcharts.com/docs/v5/charts/map-chart/map-raster-series/
var satelliteSeries = chart.series.push(am5map.MapRasterSeries.new(root, {
  visible: false,
  // the map fits the countries, not the whole picture
  affectsBounds: false
}));

// Create graticule series: grid lines every 10 degrees
// https://www.amcharts.com/docs/v5/charts/map-chart/graticule-series/
var graticuleSeries = chart.series.push(am5map.GraticuleSeries.new(root, {
  step: 10
}));

graticuleSeries.mapLines.template.setAll({
  stroke: root.interfaceColors.get("alternativeBackground"), // contrasting with the background...
  strokeOpacity: 0.08 // ...and very faint
});

// Create main polygon series for countries
// https://www.amcharts.com/docs/v5/charts/map-chart/map-polygon-series/
var polygonSeries = chart.series.push(am5map.MapPolygonSeries.new(root, {
  geoJSON: am5geodata_worldLow // the world's countries, in low detail
}));

polygonSeries.mapPolygons.template.setAll({
  tooltipText: "{name}",            // the country's name on hover (members get more, below)
  templateField: "polygonSettings", // per-country settings from the data's polygonSettings
  interactive: true                 // reacts to the pointer, for the hover state
});

// Colors from the theme, for the members
var colors = am5.ColorSet.new(root, {});

// both fill the country; over the satellite picture they turn to a bright outline instead (see below)
polygonSeries.mapPolygons.template.states.create("hover", {
  fill: root.interfaceColors.get("primaryButtonHover"), // the theme's button hover color
  fillOpacity: 1
});

polygonSeries.mapPolygons.template.states.create("active", {
  fill: colors.getIndex(4), // members light up in the theme's fifth color, which stands apart from the land
  fillOpacity: 1
});

// Members get the year they joined in their tooltip, through the template field
polygonSeries.data.setAll(data.map(function(row) {
  return {
    id: row.country, // the country's two-letter code
    polygonSettings: { tooltipText: "{name}: joined in " + row.year }
  };
}));

// Set clicking on "water" to zoom out
chart.chartContainer.get("background").events.on("click", function() {
  chart.goHome();
})

// The image credit
var credit = chart.children.push(am5.Label.new(root, {
  text: "Imagery: NASA Earth Observatory",
  fontSize: 12,              // small...
  fill: am5.color(0xffffff), // ...white...
  fillOpacity: 0.6,          // ...slightly faded text
  x: am5.p100,               // at the right edge...
  centerX: am5.p100,         // ...anchored by its right end...
  dx: -10,                   // ...10px in from it
  y: 10,                     // 10px from the top
  visible: false             // shown only with the satellite picture
}));

// The countries' own look, to go back to
var landTemplate = polygonSeries.mapPolygons.template;
var landLook = {
  fillOpacity: landTemplate.get("fillOpacity", 1),
  stroke: landTemplate.get("stroke", root.interfaceColors.get("background")),
  strokeOpacity: landTemplate.get("strokeOpacity", 1)
};

// Hovered and active countries: their own look on the map, only a bright outline over the satellite picture
var outlineLook = { fillOpacity: 0, strokeOpacity: 1, strokeWidth: 2 };
var hoverState = landTemplate.states.lookup("hover");
var hoverLook = stateLook(hoverState);
var activeState = landTemplate.states.lookup("active");
var activeLook = stateLook(activeState);

// the settings of a state that the outline changes, as they are on the map
function stateLook(state) {
  return {
    fillOpacity: state.get("fillOpacity", landLook.fillOpacity),
    strokeOpacity: state.get("strokeOpacity", landLook.strokeOpacity),
    strokeWidth: state.get("strokeWidth", landTemplate.get("strokeWidth", 1))
  };
}

// The picture loads the first time it shows. Then the countries turn to white outlines over it, the grid lines
// turn white, the credit shows and the map sits in near-black space
satelliteSeries.on("visible", function(visible) {
  if (visible) {
    satelliteSeries.set("src", "https://cdn.amcharts.com/lib/5/geodata/images/earthDay2048.jpg");
  }
  credit.set("visible", visible);
  title.set("fill", visible ? am5.color(0xffffff) : root.interfaceColors.get("text"));
  chart.get("background").set("fillOpacity", visible ? 1 : 0);
  var look = visible ? { fillOpacity: 0, stroke: am5.color(0xffffff), strokeOpacity: 0.6 } : landLook;
  landTemplate.setAll(look);
  hoverState.setAll(visible ? outlineLook : hoverLook);
  activeState.setAll(visible ? outlineLook : activeLook);
  // a country hovered before kept the look it had then as its own and as its default one: give it the new look
  polygonSeries.mapPolygons.each(function (polygon) {
    var defaultState = polygon.states.lookup("default");
    if (defaultState) {
      defaultState.setAll(look);
    }
    polygon.setAll(polygon.get("active") ? (visible ? outlineLook : activeLook) : look);
  });
  graticuleSeries.mapLines.template.set("stroke", visible ? am5.color(0xffffff) : root.interfaceColors.get("alternativeBackground"));
});

// Make stuff animate on load
chart.appear(1000, 100);

// Aggregate data
var years = {};        // the countries that joined each year, by year
var firstYear = 99999; // the earliest year, found below
var lastYear = 0;      // the latest year
for(var i = 0; i < data.length; i++) {
  var row = data[i];
  var year = row.year;
  if (years[year] == undefined) {
    years[year] = [];
  }
  years[year].push(row.country);

  if (firstYear > year) {
    firstYear = year;
  }
  if (lastYear < year) {
    lastYear = year;
  }
}

// Create controls
// in the room below the map
var container = chart.children.push(am5.Container.new(root, {
  position: "absolute",          // placed by x and y, not by the layout
  y: am5.p100,                   // at the bottom of the map...
  dy: 50,                        // ...moved down into the chart's bottom padding, off the map
  centerX: am5.p50,              // anchored by its middle...
  centerY: am5.p100,             // ...and its bottom edge
  x: am5.p50,                    // in the middle across
  width: am5.percent(90),        // 90% of the chart's width
  layout: root.horizontalLayout, // the play button and the slider side by side
  paddingBottom: 10              // 10px above the bottom edge
}));

var playButton = container.children.push(am5.Button.new(root, {
  themeTags: ["play"], // the theme's round play button, which toggles active on each click
  centerY: am5.p50,    // centered vertically
  marginRight: 40,     // a 40px gap before the slider
  icon: am5.Graphics.new(root, {
    themeTags: ["icon"] // the theme draws a play icon, or pause when active
  })
}));

// the play button pauses the slider's animation, or plays it on from where it is
playButton.events.on("click", function () {
  if (playButton.get("active")) {
    // setting start stops its running animation, which pauses the play
    slider.set("start", slider.get("start") + 0.0001);
  } else {
    // play on to the end, at 15 seconds for the whole range of years
    slider.animate({
      key: "start",
      to: 1,
      duration: 15000 * (1 - slider.get("start"))
    });
  }
});

var slider = container.children.push(am5.Slider.new(root, {
  orientation: "horizontal",
  start: 0,        // the grip starts at the first year
  centerY: am5.p50 // centered vertically
}));

slider.startGrip.get("icon").set("forceHidden", true); // no grip icon: the year label below takes its place
// the grip shows the year, in the theme's text color
slider.startGrip.set("label", am5.Label.new(root, {
  text: firstYear + "",
  fill: root.interfaceColors.get("text"),
  paddingTop: 0,
  paddingRight: 0,
  paddingBottom: 0,
  paddingLeft: 0
}));

// light up the first year's countries once the map is ready
polygonSeries.events.once("datavalidated", function() {
  updateCountries(firstYear);
});

// moving the grip shows its year on it and lights up the countries that had joined by then
slider.events.on("rangechanged", function () {
  // the slider's position, from 0 to 1, turned into a year
  var year = firstYear + Math.round(slider.get("start", 0) * (lastYear - firstYear));
  slider.startGrip.get("label").set("text", year + "");
  updateCountries(year);
});

// sets every country that joined in or before the given year active, and the rest not
function updateCountries(year) {
  am5.object.each(years, function(joinYear, countries) {
    am5.array.each(countries, function(country) {
      var dataItem = polygonSeries.getDataItemById(country);
      if (dataItem) {
        dataItem.get("mapPolygon").set("active", joinYear <= year)
      }
    })
  })
}
Full apps and games built with amCharts 5.


