A world map where you pick countries: click a country to select it, click it again to clear it, and select as many as you like.
A map that remembers clicks works as an input, not just a picture: readers can mark the countries they’ve been to, the markets they serve or the regions to filter a report by. One setting, toggleKey, makes each click switch a country between selected and not, and the active state gives the selected ones their color.
Built with amCharts 5, a JavaScript library. The JavaScript includes your theme and renderer (canvas or SVG); the JSON also follows the changes you make with the controls.
npm install @amcharts/amcharts5 and @amcharts/amcharts5-geodata. See Getting started.
The same chart as a JSON config. Chart Maker reads and writes this format, the library's JSON parser turns it into a chart, and the <am5-chart> element puts it on a page with no code."type" is the class to create and "settings" what you would pass to its new() in code; "properties" fill in its parts, lists such as series and axes or templates such as columns.template; "refs" holds objects used in more than one place ("#series-0" stands for the one named series-0); a string starting with "@" takes a value from another object, such as "@series.get('fill')".
A complete page. Save it as an .html file and open it in a browser.
Paste this into an AI coding assistant to build the chart from scratch. More in amCharts & AI.
// Create root element
// https://www.amcharts.com/docs/v5/getting-started/#Root_element
var root = am5.Root.new("chartdiv");

// Set themes
// https://www.amcharts.com/docs/v5/concepts/themes/
root.setThemes([
  am5themes_Animated.new(root),
  am5themes_Responsive.new(root)
]);

// Create the map chart
// https://www.amcharts.com/docs/v5/charts/map-chart/
var chart = root.container.children.push(am5map.MapChart.new(root, {
  minZoomLevel: 0.5, // zoom out to half the fitted size at most
  // go to the home view once the map is fitted
  autoHome: true,
  // a sideways drag turns the world around, so it wraps at the edges; up and down moves it
  panX: "rotateX",
  panY: "translateY",
  projection: am5map.geoEqualEarth() // a flat world map that keeps the countries' areas true
}));

// Create series for the water: a faint fill behind the countries
// https://www.amcharts.com/docs/v5/charts/map-chart/map-polygon-series/#Background_polygon
var waterSeries = chart.series.push(am5map.MapPolygonSeries.new(root, {
  // the map fits the countries, not this rectangle around the whole world
  affectsBounds: false
}));

waterSeries.mapPolygons.template.setAll({
  fill: root.interfaceColors.get("alternativeBackground"), // the theme's text color: works in light and dark
  fillOpacity: 0.05, // a faint tint
  strokeOpacity: 0   // no outline
});

// one polygon that covers the whole Earth: the water
waterSeries.data.push({
  geometry: am5map.getGeoRectangle(90, 180, -90, -180)
});

// Create graticule series: grid lines every 10 degrees
// https://www.amcharts.com/docs/v5/charts/map-chart/graticule-series/
var graticuleSeries = chart.series.push(am5map.GraticuleSeries.new(root, {
  step: 10
}));

graticuleSeries.mapLines.template.setAll({
  stroke: root.interfaceColors.get("alternativeBackground"), // lines in the theme's text color
  strokeOpacity: 0.08 // barely visible
});

// Create main polygon series for countries
// https://www.amcharts.com/docs/v5/charts/map-chart/map-polygon-series/
var polygonSeries = chart.series.push(am5map.MapPolygonSeries.new(root, {
  geoJSON: am5geodata_worldLow // country shapes from the low-detail world map
}));

polygonSeries.mapPolygons.template.setAll({
  tooltipText: "{name}", // hover a country for its name
  // a click turns a country's "active" state on or off, so any number can be selected
  toggleKey: "active",
  interactive: true // the countries react to the pointer
});

// a country under the pointer, and the selected ones, take the theme's button colors
polygonSeries.mapPolygons.template.states.create("hover", {
  fill: root.interfaceColors.get("primaryButtonHover") // the button hover color
});

polygonSeries.mapPolygons.template.states.create("active", {
  fill: root.interfaceColors.get("primaryButtonActive") // the active button color
});

// a few countries start selected, once the series has drawn them
polygonSeries.events.once("datavalidated", function () {
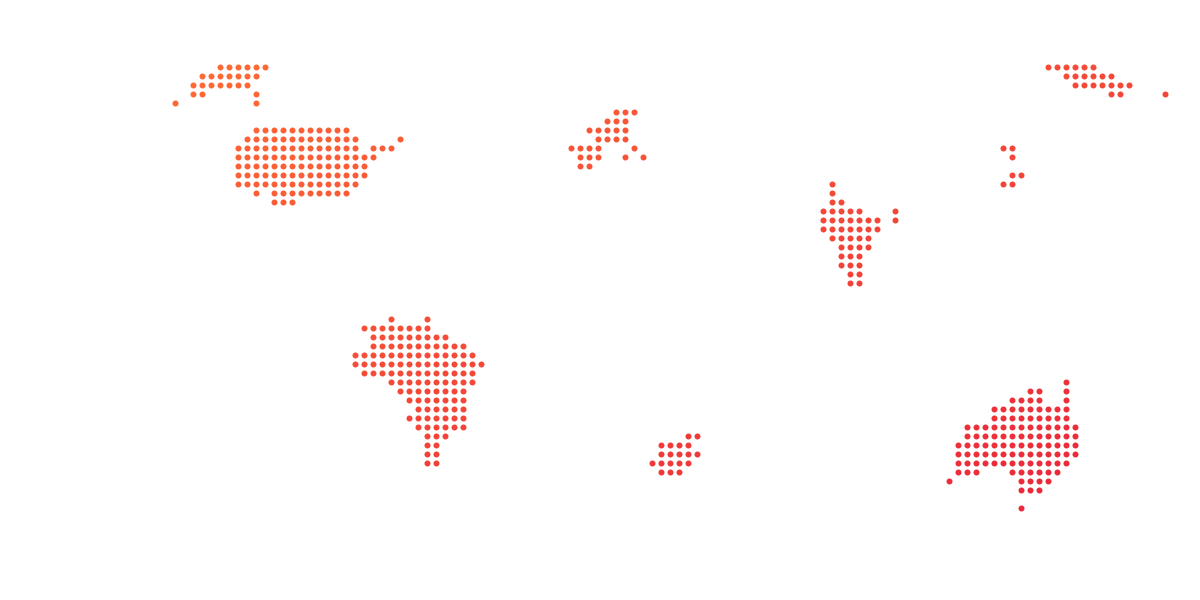
  ["CA", "BR", "IN", "AU"].forEach(function (id) { // Canada, Brazil, India and Australia
    var dataItem = polygonSeries.getDataItemById(id);
    if (dataItem) {
      dataItem.get("mapPolygon").set("active", true); // the same as a click
    }
  });
});

// Set clicking on "water" to zoom out
chart.chartContainer.get("background").events.on("click", function() {
  chart.goHome();
})

// Add zoom control
// https://www.amcharts.com/docs/v5/charts/map-chart/map-pan-zoom/#Zoom_control
var zoomControl = chart.set("zoomControl", am5map.ZoomControl.new(root, {}));

// the home button is hidden by default
zoomControl.homeButton.set("visible", true);

// Make stuff animate on load
chart.appear(1000, 100);
{
"type": "MapChart",
"settings": {
"minZoomLevel": 0.5,
"autoHome": true,
"panX": "rotateX",
"panY": "translateY",
"zoomControl": {
"type": "ZoomControl",
"properties": {
"homeButton": {
"settings": {
"visible": true
}
}
}
},
"projectionName": "geoEqualEarth"
},
"properties": {
"series": [
"#series-0",
"#series-1",
"#series-2"
]
},
"refs": [
{
"data-0": [
{
"geometry": {
"type": "GeoRectangle",
"north": 90,
"east": 180,
"south": -90,
"west": -180
},
"__parse": true
}
]
},
{
"data-1": []
},
{
"data-2": []
},
{
"series-0": {
"type": "MapPolygonSeries",
"settings": {
"affectsBounds": false
},
"properties": {
"data": "#data-0",
"mapPolygons": {
"properties": {
"template": {
"settings": {
"fill": "@root.interfaceColors.get('alternativeBackground')",
"fillOpacity": 0.05,
"strokeOpacity": 0
}
}
}
}
}
}
},
{
"series-1": {
"type": "GraticuleSeries",
"settings": {
"step": 10
},
"properties": {
"mapLines": {
"properties": {
"template": {
"settings": {
"stroke": "@root.interfaceColors.get('alternativeBackground')",
"strokeOpacity": 0.08
}
}
}
}
}
}
},
{
"series-2": {
"type": "MapPolygonSeries",
"settings": {
"geoJSON": "am5geodata_worldLow"
},
"properties": {
"mapPolygons": {
"properties": {
"template": {
"settings": {
"tooltipText": "{name}",
"toggleKey": "active",
"interactive": true
},
"states": [
{
"key": "hover",
"settings": {
"fill": "@root.interfaceColors.get('primaryButtonHover')"
}
},
{
"key": "active",
"settings": {
"fill": "@root.interfaceColors.get('primaryButtonActive')"
}
}
]
}
}
}
}
}
}
]
}
Full apps and games built with amCharts 5.


