Mexico City Boroughs SVG Map
Free Mexico City Boroughs SVG map with 16 boroughs, in Mercator projection, high and low detail.
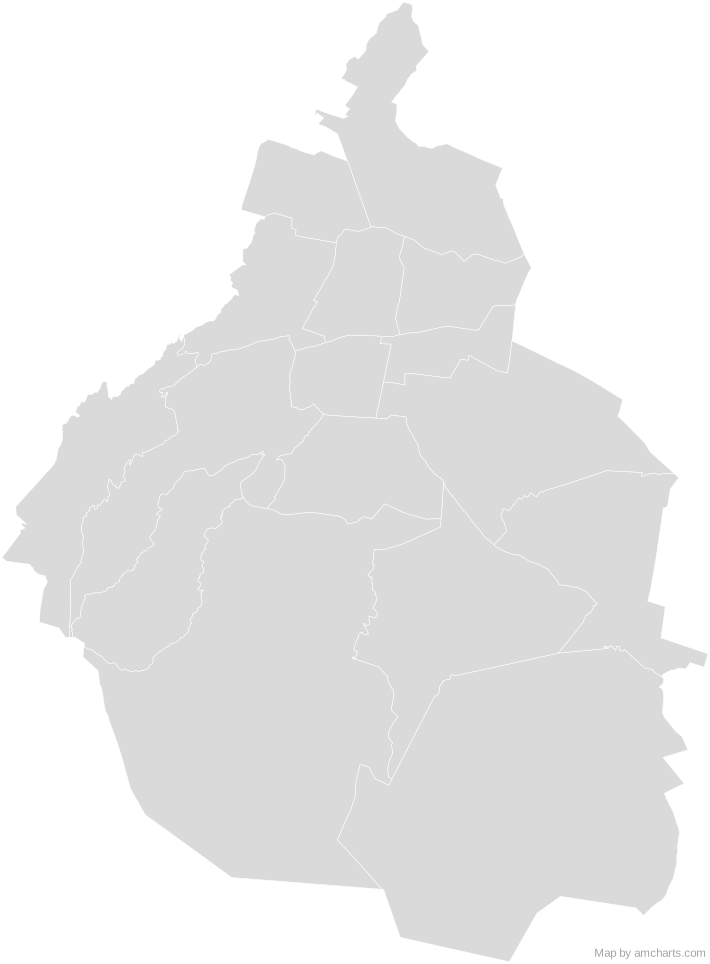
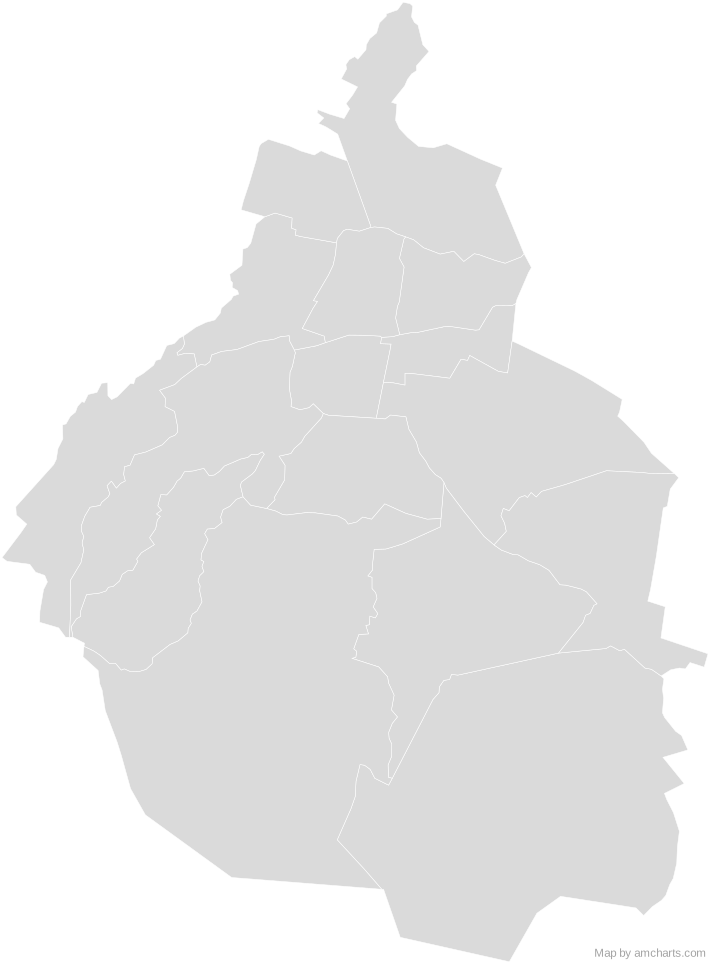
Free for any use, commercial projects included, as long as you keep the amCharts credit (CC BY 4.0).
All 427 maps, no credit needed: $99 Every SVG map in one ZIP, royalty-free, with updates.16 regions, named and coded.
- Álvaro Obregón
09010 - Azcapotzalco
09002 - Benito Juárez
09014 - Coyoacán
09003 - Cuajimalpa de Morelos
09004 - Cuauhtémoc
09015 - Gustavo A. Madero
09005 - Iztacalco
09006 - Iztapalapa
09007 - La Magdalena Contreras
09008 - Miguel Hidalgo
09016 - Milpa Alta
09009 - Tláhuac
09011 - Tlalpan
09012 - Venustiano Carranza
09017 - Xochimilco
09013
No region matches that.
Need it interactive in your app?
The same map ships with the amCharts 5 library as am5geodata_region_mexico_cmxLow, ready for zoom, tooltips, heat maps and drill-downs. See JavaScript Maps.
import am5geodata from "@amcharts/amcharts5-geodata/region/mexico/cmxLow";

chart.series.push(
  am5map.MapPolygonSeries.new(root, {
    geoJSON: am5geodata
  })
);Around Mexico City Boroughs
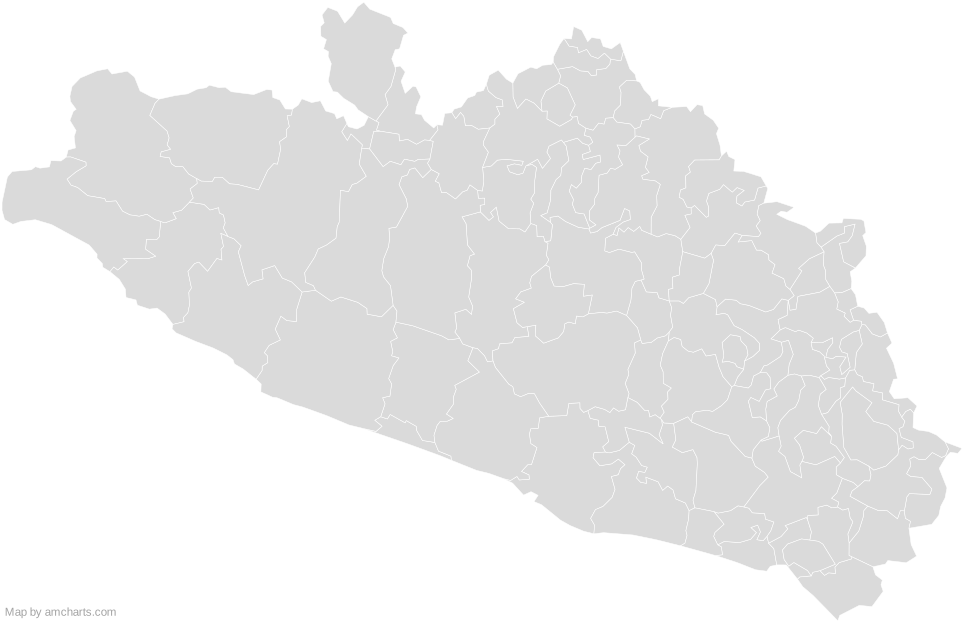 Guerrero MunicipalitiesMexico Municipalities
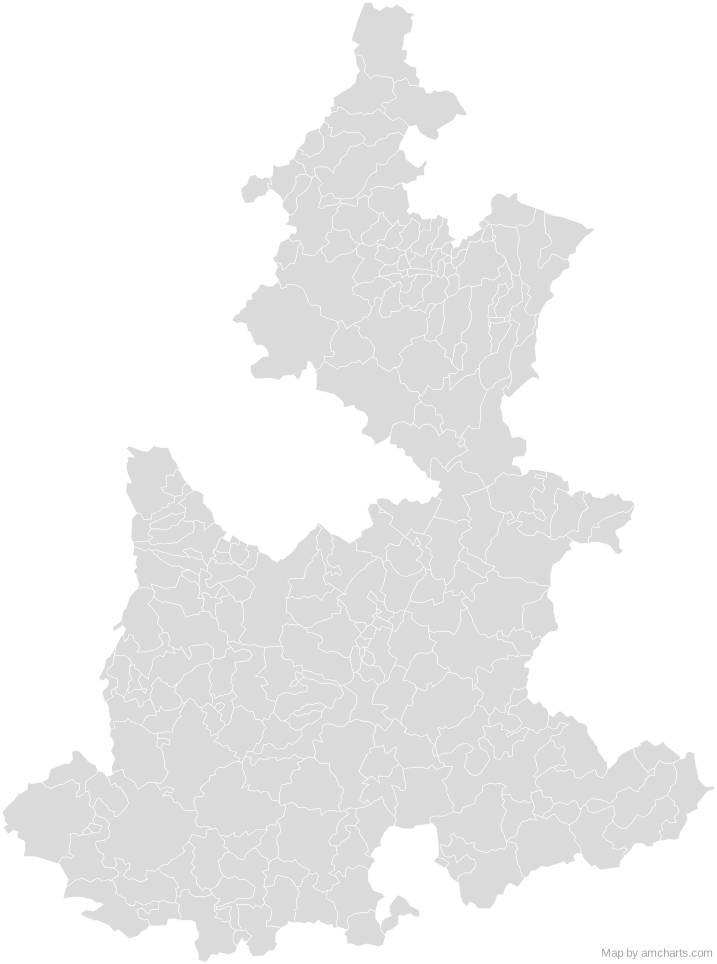 Puebla MunicipalitiesMexico Municipalities
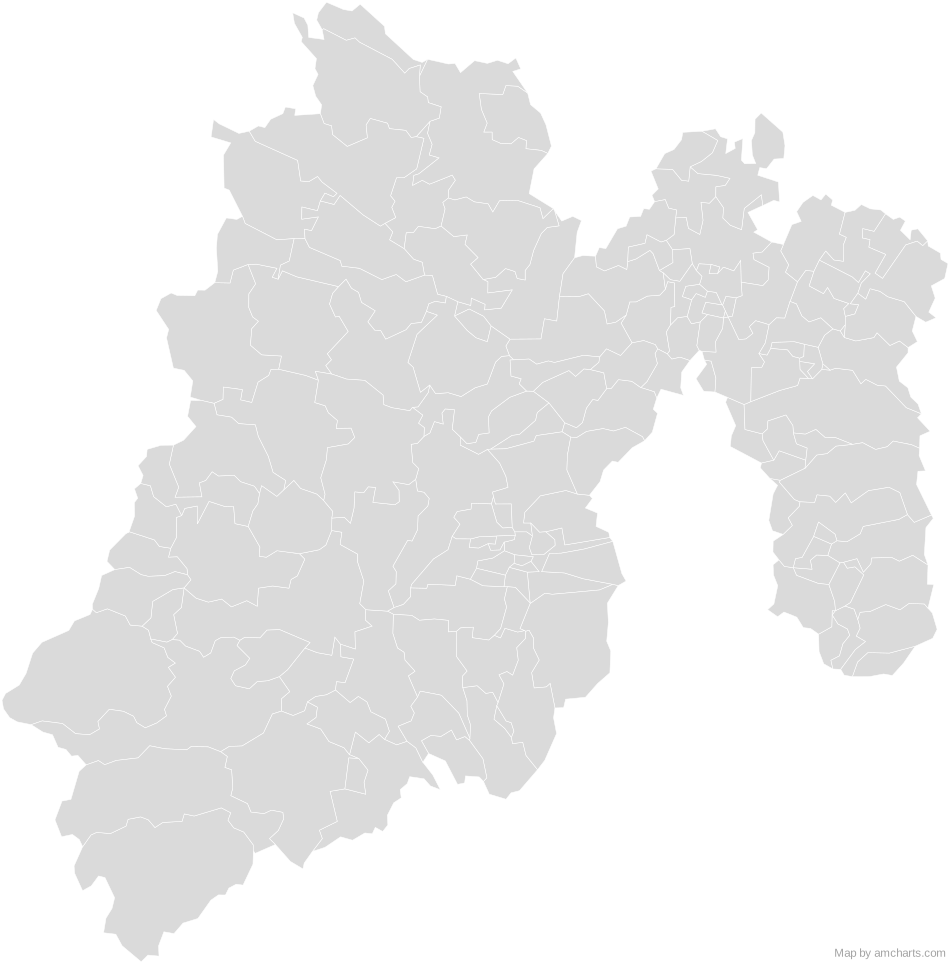 State of Mexico MunicipalitiesMexico Municipalities
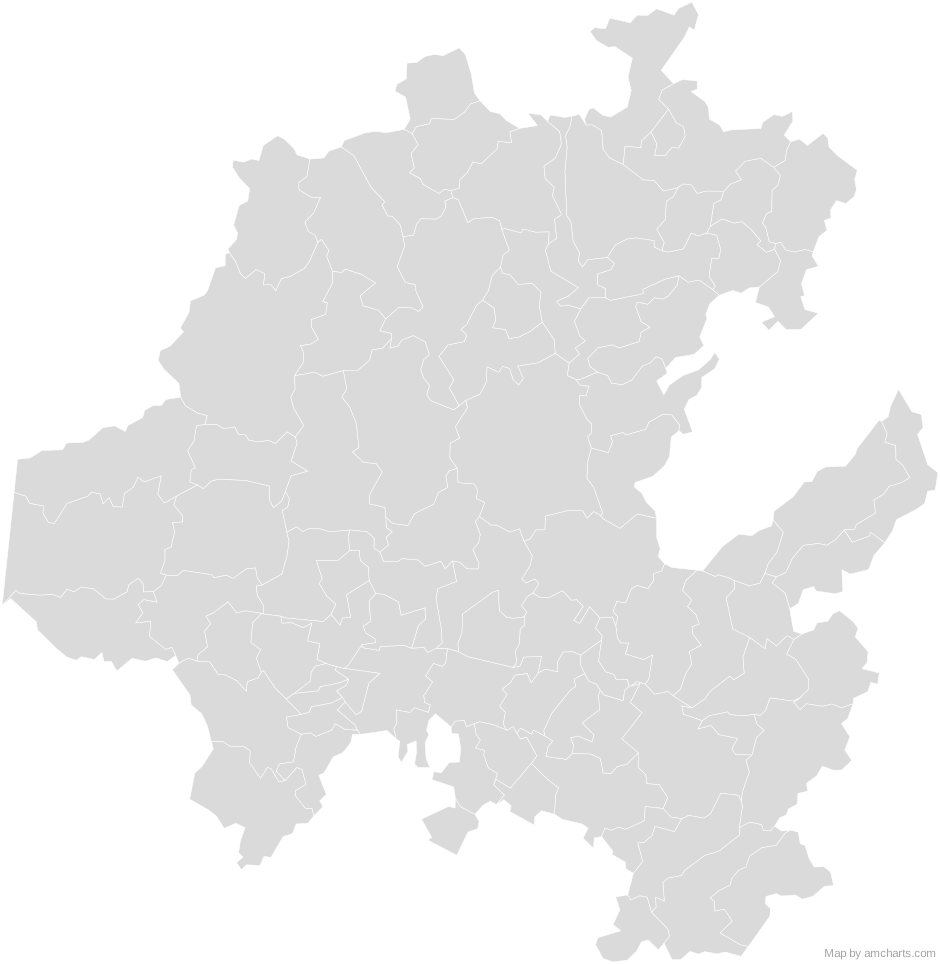 Hidalgo MunicipalitiesMexico Municipalities
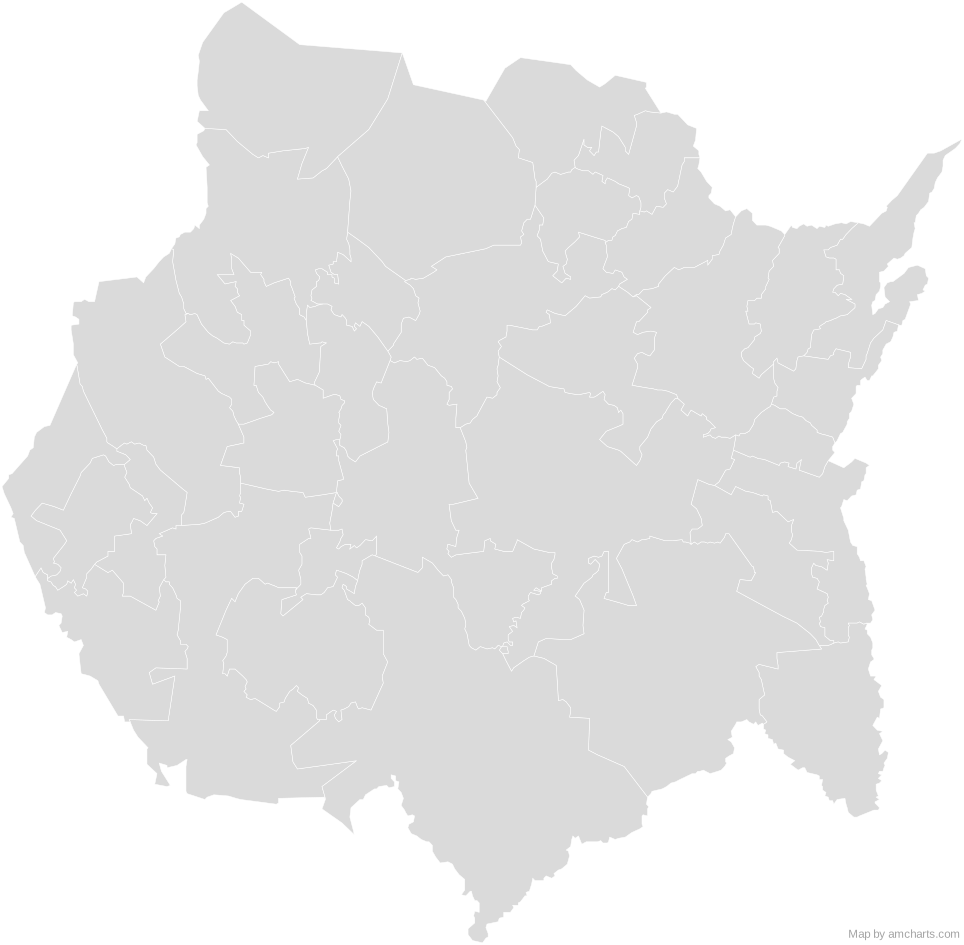 Morelos MunicipalitiesMexico Municipalities
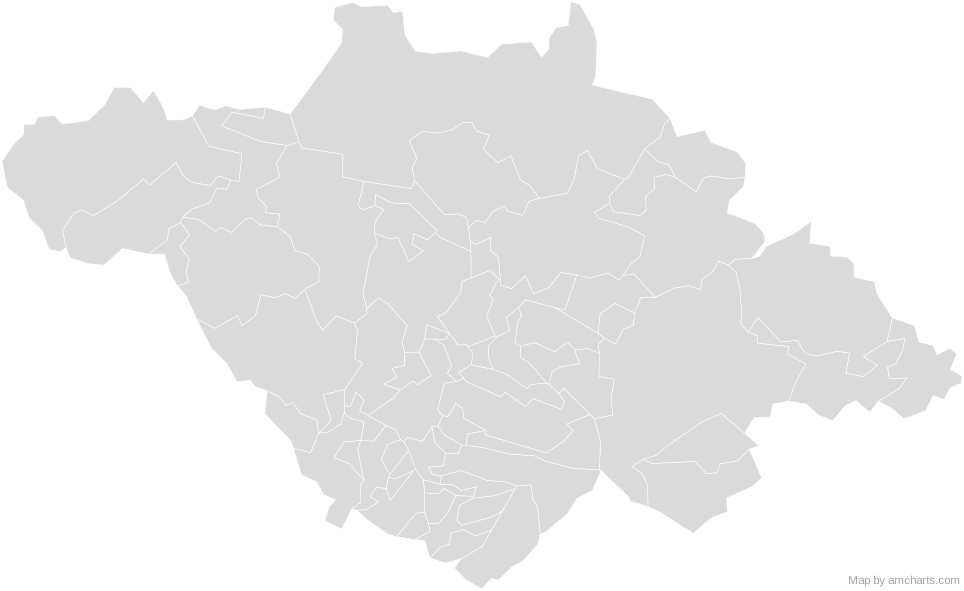 Tlaxcala MunicipalitiesMexico Municipalities
 Queretaro MunicipalitiesMexico Municipalities
 Mexico Municipalities
Can I use this map commercially?
Yes, for free, as long as you keep the amCharts credit (CC BY 4.0). To use maps without the credit, get the SVG Maps pack: all 427 maps for $99, one payment.
Which projection is it in?
Mercator, fitted to the map's own bounds. For Equal Earth, Albers, orthographic and others, use the SVG Map Generator.
How are the regions identified?
Each region is its own <path> with an id (the ISO code where one exists) and a data-name, so you can style or script it directly.
Will it open in Figma, Illustrator or Inkscape?
Yes. It is plain SVG: no scripts, fonts or external references.